SOM cluster: 2181
Cluster Hypersensitivity Profile

Genomic Location Trend
These plots show the distribution of the DHS sites surrounding the Transcript Start Site of the nearest gene.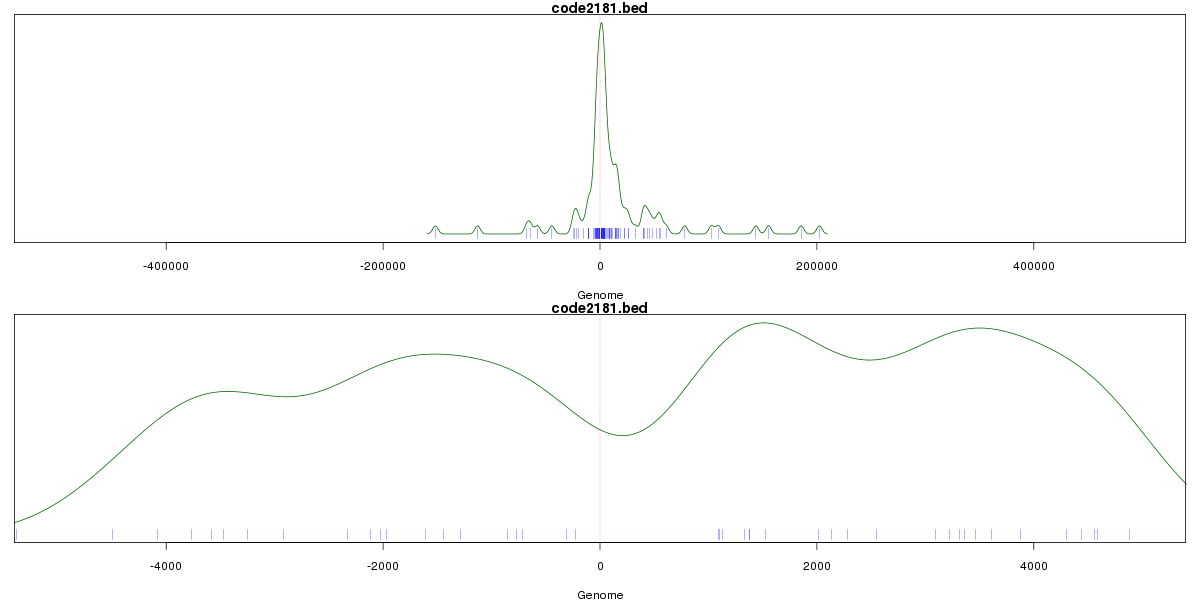
Stats
Number of sites: 359Promoter: 10%
CpG-Island: 1%
Conserved: 34%
Enriched Motifs & Matches
Match Detail: [Jaspar]
|
| ||
|---|---|---|
| Sites: 34/100 | e-val: 0.0000075 | ||
| Factor | e-val(match) | DB |
| Foxa2 | 0.000000000013707 | JASPAR |
| FOXA1 | 0.000000000066855 | JASPAR |
| Foxd3 | 0.000000057299 | JASPAR |
| FOXI1 | 0.00000021023 | JASPAR |
| FOXF2 | 0.0000012887 | JASPAR |
|
| ||
| Sites: 31/100 | e-val: 0.000016 | ||
| Factor | e-val(match) | DB |
| TP53 | 0.00037691 | JASPAR |
| TLX1::NFIC | 0.0061967 | JASPAR |
| INSM1 | 0.013843 | JASPAR |
| Stat3 | 0.019436 | JASPAR |
| Myf | 0.038037 | JASPAR |
BED file downloads
Top 10 Example Regions
| Location | Gene Link | Dist. |
|---|---|---|
| chr22: 45634660-45634810 | KIAA0930 | 33.83 |
| chr22: 45634660-45634810 | UPK3A | 33.83 |
| chr22: 45634660-45634810 | CTA-268H5.9 | 33.83 |
| chr1: 45243140-45243290 | C1orf228 | 38.76 |
| chr5: 132162385-132162535 | SHROOM1 | 45.53 |
| chr5: 132162385-132162535 | LEAP2 | 45.53 |
| chr19: 1356285-1356435 | GAMT | 56.2 |
| chr11: 61343560-61343710 | SYT7 | 56.78 |
| chr7: 73135980-73136130 | CLDN3 | 56.99 |
| chr11: 126137600-126137750 | TIRAP | 64.04 |