SOM cluster: 2192
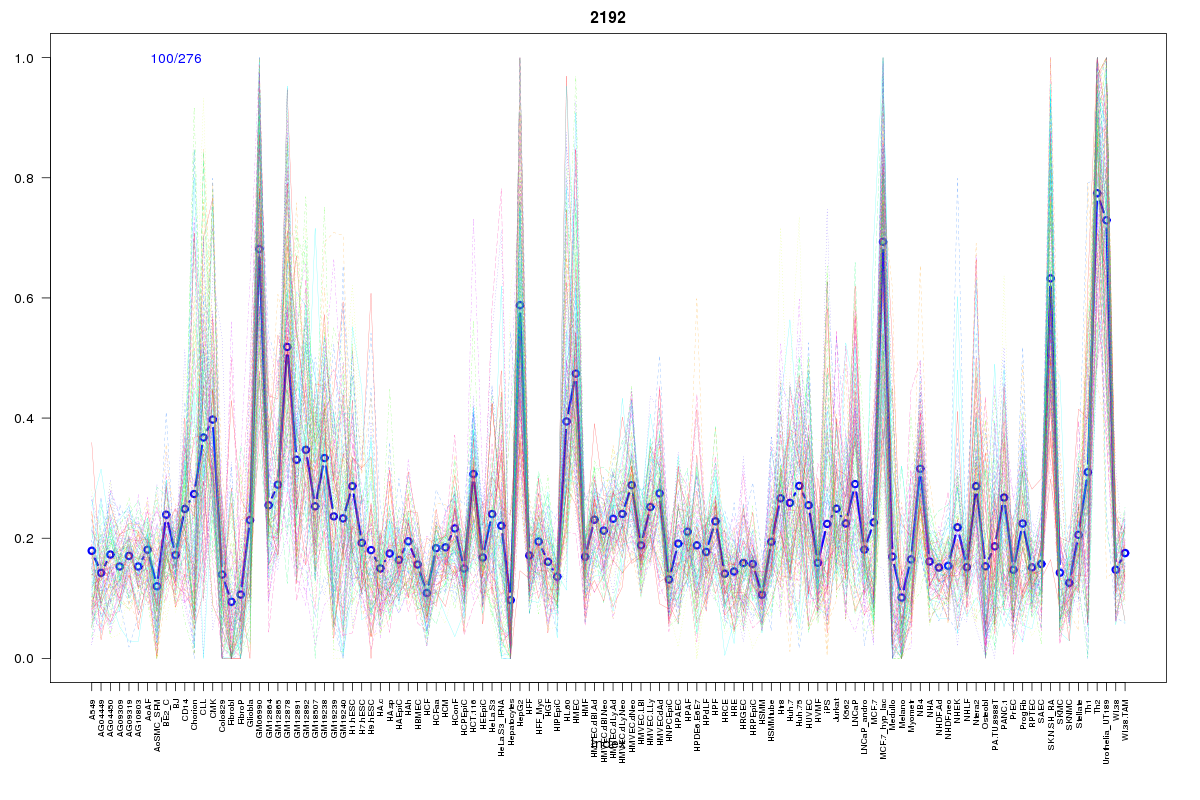
Cluster Hypersensitivity Profile

Genomic Location Trend
These plots show the distribution of the DHS sites surrounding the Transcript Start Site of the nearest gene.
Stats
Number of sites: 276Promoter: 26%
CpG-Island: 92%
Conserved: 64%
Enriched Motifs & Matches
Match Detail: [Jaspar]
|
| ||
|---|---|---|
| Sites: 99/100 | e-val: 0 | ||
| Factor | e-val(match) | DB |
| SP1 | 0.000000023203 | JASPAR |
| TFAP2A | 0.00083661 | JASPAR |
| Klf4 | 0.017075 | JASPAR |
| PLAG1 | 0.022329 | JASPAR |
| Egr1 | 0.029995 | JASPAR |
|
| ||
| Sites: 99/100 | e-val: 2.5e-29 | ||
| Factor | e-val(match) | DB |
| SP1 | 0.000034712 | JASPAR |
| Klf4 | 0.0007235 | JASPAR |
| Egr1 | 0.0076202 | JASPAR |
| TFAP2A | 0.019555 | JASPAR |
| NHLH1 | 0.020056 | JASPAR |
BED file downloads
Top 10 Example Regions
| Location | Gene Link | Dist. |
|---|---|---|
| chr1: 150294125-150294275 | C1orf54 | 35.27 |
| chr1: 150294125-150294275 | ANP32E | 35.27 |
| chr1: 150294125-150294275 | MRPS21 | 35.27 |
| chr8: 71581145-71581295 | AC120194.1 | 43.47 |
| chr8: 126010945-126011095 | NSMCE2 | 49.12 |
| chr9: 115512680-115512830 | INIP | 49.7 |
| chr17: 27053705-27053855 | TRAF4 | 50.65 |
| chr17: 27053705-27053855 | SDF2 | 50.65 |
| chr17: 27053705-27053855 | RPL23A | 50.65 |
| chr3: 13521200-13521350 | NUP210 | 52.28 |