SOM cluster: 2219
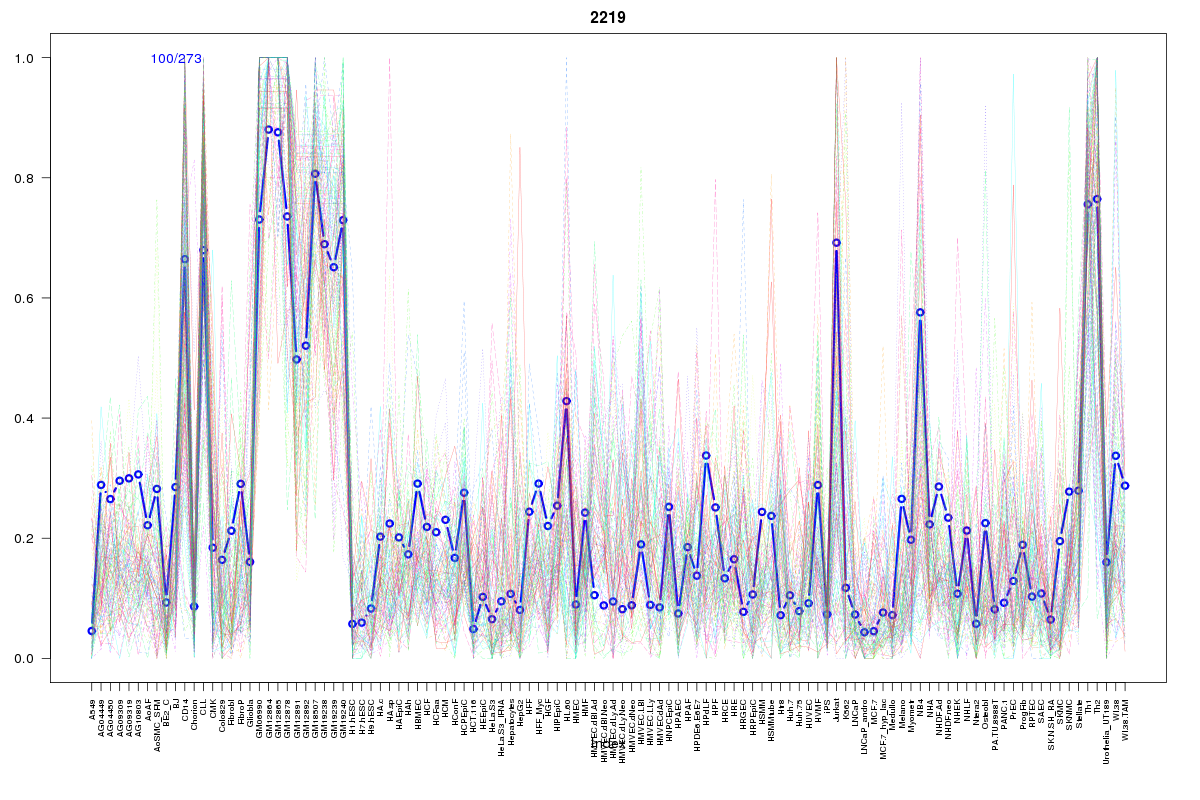
Cluster Hypersensitivity Profile

Genomic Location Trend
These plots show the distribution of the DHS sites surrounding the Transcript Start Site of the nearest gene.
Stats
Number of sites: 273Promoter: 12%
CpG-Island: 7%
Conserved: 45%
Enriched Motifs & Matches
Match Detail: [Jaspar]
|
| ||
|---|---|---|
| Sites: 38/100 | e-val: 1.3e-32 | ||
| Factor | e-val(match) | DB |
| IRF1 | 0.00000030719 | JASPAR |
| IRF2 | 0.0001095 | JASPAR |
| SPI1 | 0.0030063 | JASPAR |
| SPIB | 0.0061246 | JASPAR |
| FEV | 0.018881 | JASPAR |
BED file downloads
Top 10 Example Regions
| Location | Gene Link | Dist. |
|---|---|---|
| chr3: 194210720-194210870 | LINC00884 | 35.58 |
| chr22: 37270120-37270270 | CSF2RB | 41.75 |
| chr22: 37270120-37270270 | LL22NC01-81G9.3 | 41.75 |
| chr22: 37270120-37270270 | PVALB | 41.75 |
| chr22: 37270120-37270270 | NCF4 | 41.75 |
| chr7: 45020400-45020550 | SNHG15 | 49.14 |
| chr7: 45020400-45020550 | NACAD | 49.14 |
| chr1: 159891100-159891250 | IGSF9 | 54.97 |
| chr1: 159891100-159891250 | LINC01133 | 54.97 |
| chr10: 26727160-26727310 | APBB1IP | 57.44 |