SOM cluster: 2228
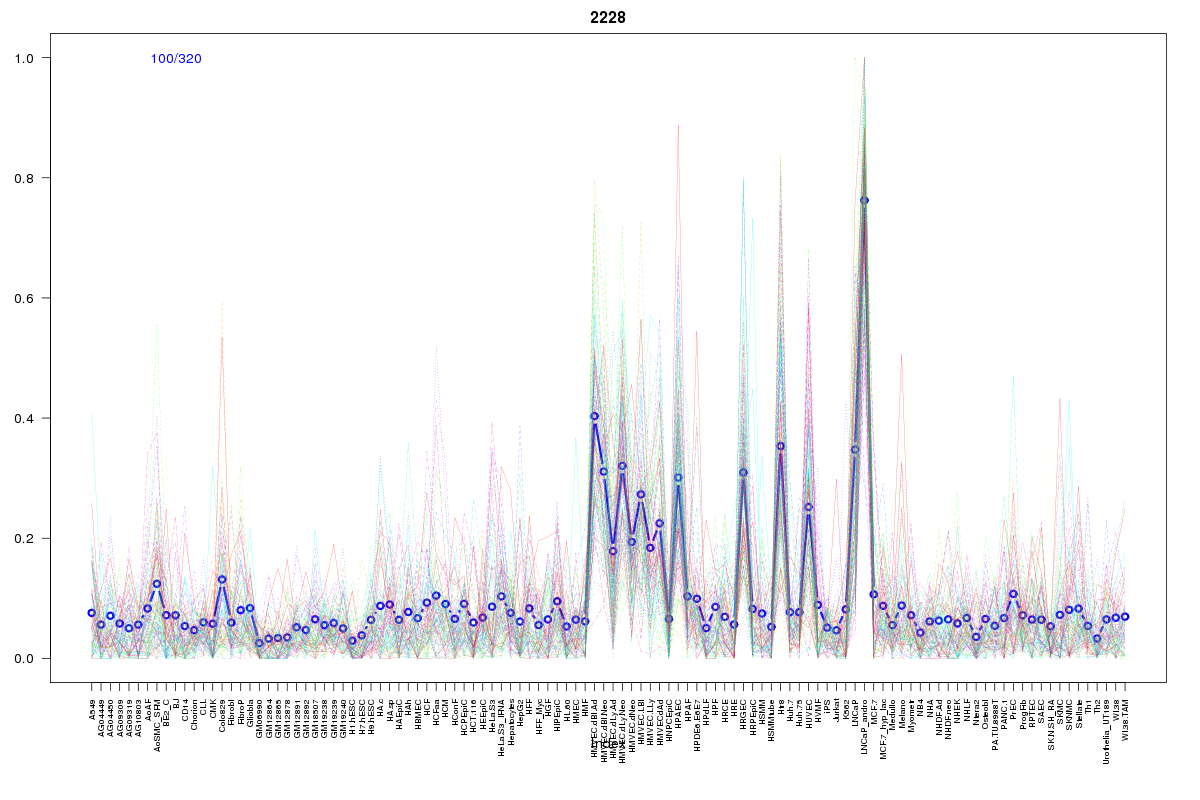
Cluster Hypersensitivity Profile

Genomic Location Trend
These plots show the distribution of the DHS sites surrounding the Transcript Start Site of the nearest gene.
Stats
Number of sites: 320Promoter: 2%
CpG-Island: 0%
Conserved: 45%
Enriched Motifs & Matches
Match Detail: [Jaspar]
|
| ||
|---|---|---|
| Sites: 56/100 | e-val: 8e-30 | ||
| Factor | e-val(match) | DB |
| FOXA1 | 0.00000000031292 | JASPAR |
| Foxd3 | 0.00000000069377 | JASPAR |
| Foxa2 | 0.0000000021496 | JASPAR |
| Foxq1 | 0.000000015312 | JASPAR |
| FOXI1 | 0.0000016321 | JASPAR |
BED file downloads
Top 10 Example Regions
| Location | Gene Link | Dist. |
|---|---|---|
| chr3: 47064160-47064310 | CCDC12 | 33.98 |
| chr12: 106155160-106155310 | CASC18 | 44.17 |
| chr1: 61598820-61598970 | NFIA | 49.24 |
| chr7: 140150280-140150430 | DENND2A | 49.26 |
| chr1: 209975900-209976050 | IRF6 | 54.12 |
| chr11: 60602720-60602870 | TMEM132A | 55.52 |
| chr11: 60602720-60602870 | RP11-881M11.1 | 55.52 |
| chr7: 56147480-56147630 | GBAS | 56.55 |
| chr7: 56147480-56147630 | CHCHD2 | 56.55 |
| chr10: 104914820-104914970 | RP11-332O19.2 | 58.28 |