SOM cluster: 2229
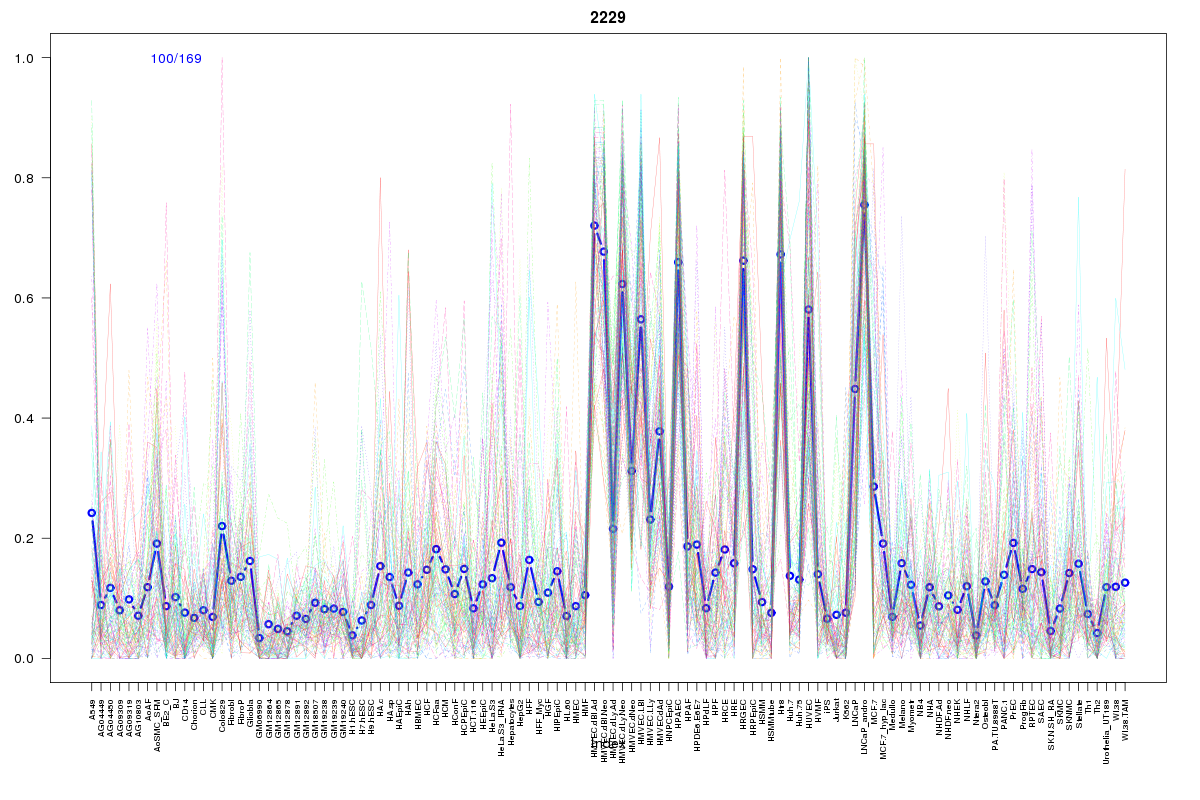
Cluster Hypersensitivity Profile

Genomic Location Trend
These plots show the distribution of the DHS sites surrounding the Transcript Start Site of the nearest gene.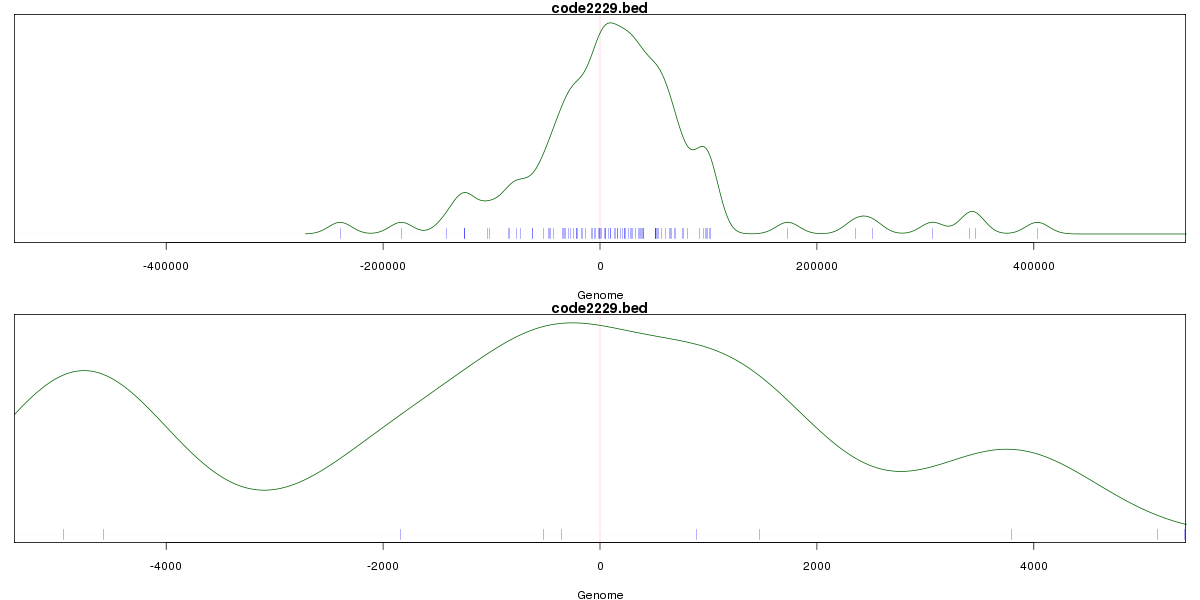
Stats
Number of sites: 169Promoter: 4%
CpG-Island: 0%
Conserved: 48%
Enriched Motifs & Matches
No motifs found.BED file downloads
Top 10 Example Regions
| Location | Gene Link | Dist. |
|---|---|---|
| chr8: 120734180-120734330 | ENPP2 | 36.63 |
| chr18: 55411700-55411850 | ATP8B1 | 46.14 |
| chr18: 55411700-55411850 | RSL24D1P11 | 46.14 |
| chr3: 149095925-149096075 | TM4SF1 | 46.26 |
| chr3: 149095925-149096075 | TM4SF18 | 46.26 |
| chr3: 4566180-4566330 | ITPR1-AS1 | 48.78 |
| chr6: 118790320-118790470 | PLN | 53.2 |
| chr9: 112685760-112685910 | PALM2-AKAP2 | 56.73 |
| chr9: 112685760-112685910 | PALM2 | 56.73 |
| chr4: 41552460-41552610 | LIMCH1 | 57.85 |