SOM cluster: 2231
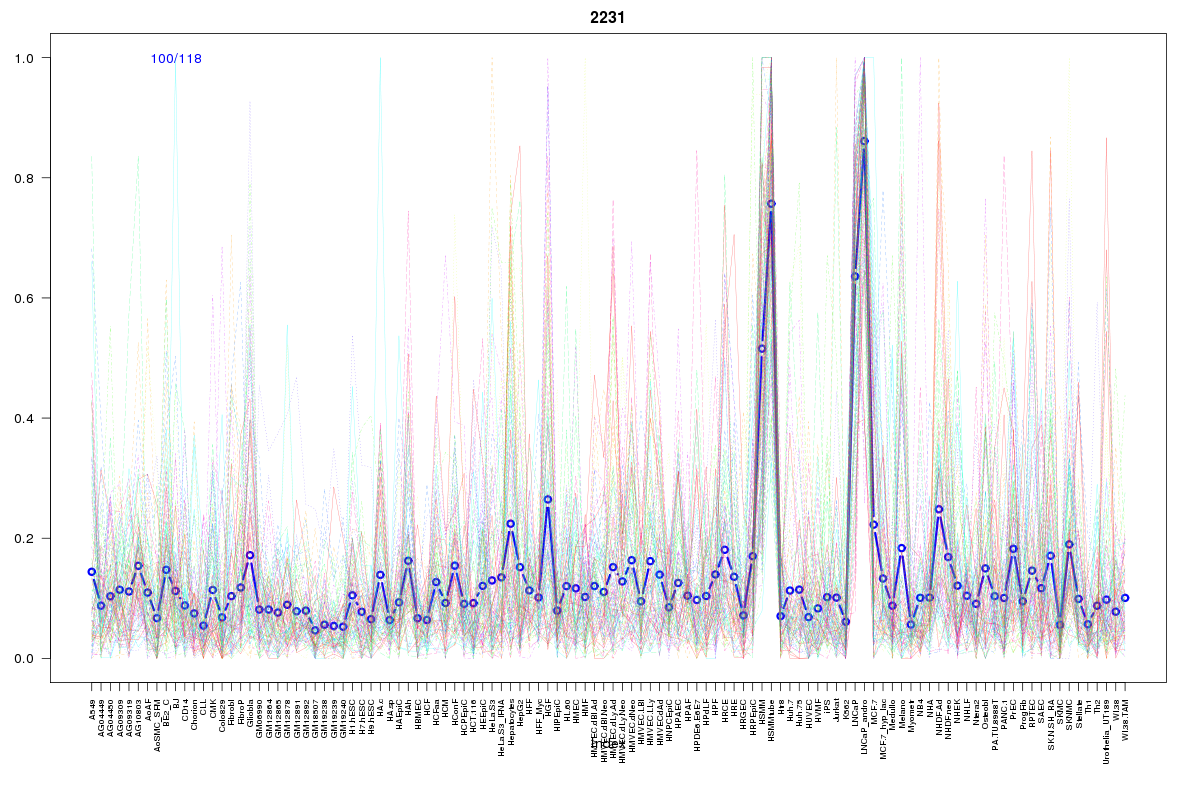
Cluster Hypersensitivity Profile

Genomic Location Trend
These plots show the distribution of the DHS sites surrounding the Transcript Start Site of the nearest gene.
Stats
Number of sites: 118Promoter: 6%
CpG-Island: 1%
Conserved: 52%
Enriched Motifs & Matches
Match Detail: [Jaspar]
|
| ||
|---|---|---|
| Sites: 73/100 | e-val: 6.8e-38 | ||
| Factor | e-val(match) | DB |
| NHLH1 | 0.000026825 | JASPAR |
| Myf | 0.000043045 | JASPAR |
| Hand1::Tcfe2a | 0.0020124 | JASPAR |
| Mycn | 0.0034968 | JASPAR |
| TLX1::NFIC | 0.0041791 | JASPAR |
|
| ||
| Sites: 56/100 | e-val: 2.7e-35 | ||
| Factor | e-val(match) | DB |
| EWSR1-FLI1 | 0.0000001354 | JASPAR |
| SP1 | 0.000013165 | JASPAR |
| RXR::RAR_DR5 | 0.002939 | JASPAR |
| INSM1 | 0.0030962 | JASPAR |
| Stat3 | 0.0047928 | JASPAR |
|
| ||
| Sites: 50/100 | e-val: 2.4e-16 | ||
| Factor | e-val(match) | DB |
| Klf4 | 0.000041355 | JASPAR |
| SP1 | 0.00012507 | JASPAR |
| Zfx | 0.0032721 | JASPAR |
| Tcfcp2l1 | 0.0039533 | JASPAR |
| TEAD1 | 0.014074 | JASPAR |
|
| ||
| Sites: 21/100 | e-val: 0.063 | ||
| Factor | e-val(match) | DB |
| PLAG1 | 0.0025953 | JASPAR |
| TFAP2A | 0.0055862 | JASPAR |
| Klf4 | 0.0067003 | JASPAR |
| TP53 | 0.010927 | JASPAR |
| INSM1 | 0.014673 | JASPAR |
BED file downloads
Top 10 Example Regions
| Location | Gene Link | Dist. |
|---|---|---|
| chr19: 38866540-38866690 | C19orf33 | 5.95 |
| chr1: 204058385-204058535 | REN | 57.77 |
| chr21: 38207860-38208010 | HLCS-IT1 | 60.12 |
| chr1: 202210605-202210755 | snoU13 | 71.44 |
| chr11: 876680-876830 | EFCAB4A | 78.92 |
| chr13: 113503960-113504110 | ATP11A | 81.95 |
| chr13: 113503960-113504110 | MCF2L | 81.95 |
| chr17: 27073780-27073930 | TRAF4 | 83.72 |
| chr17: 27073780-27073930 | TLCD1 | 83.72 |
| chr22: 39130085-39130235 | RP3-508I15.9 | 87.9 |