SOM cluster: 2246
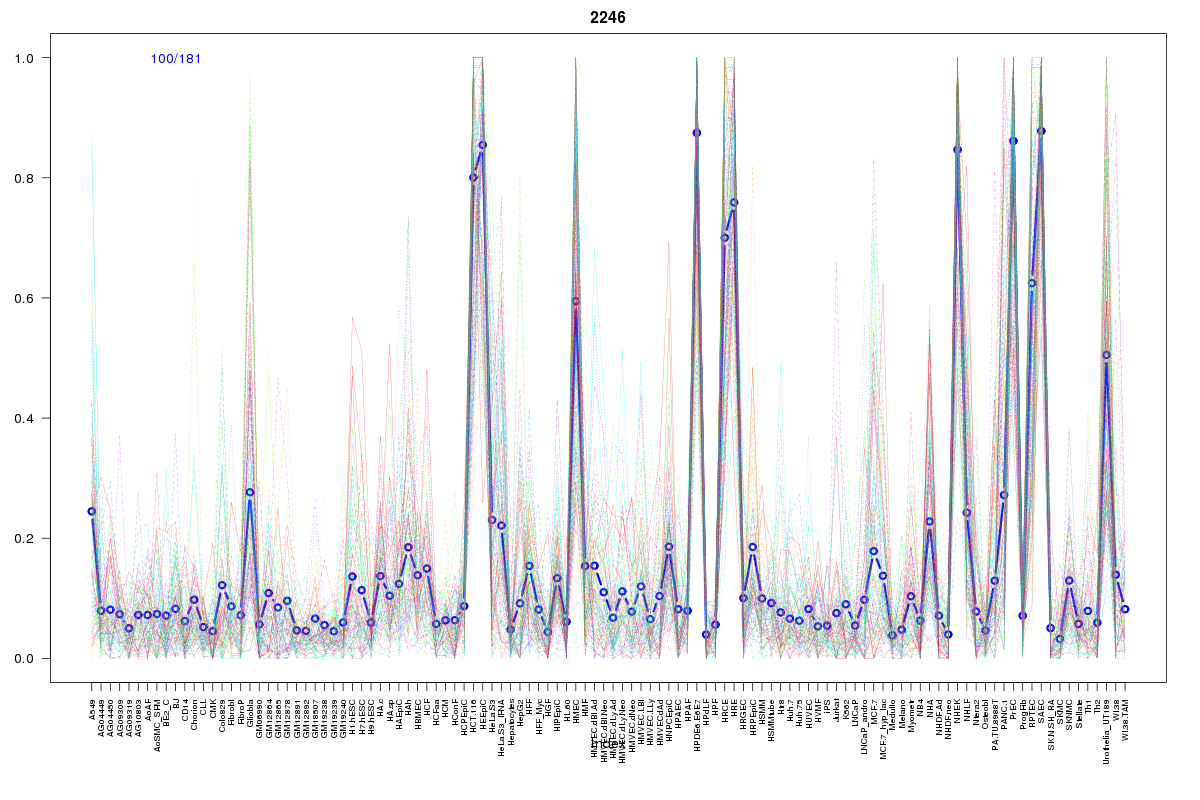
Cluster Hypersensitivity Profile

Genomic Location Trend
These plots show the distribution of the DHS sites surrounding the Transcript Start Site of the nearest gene.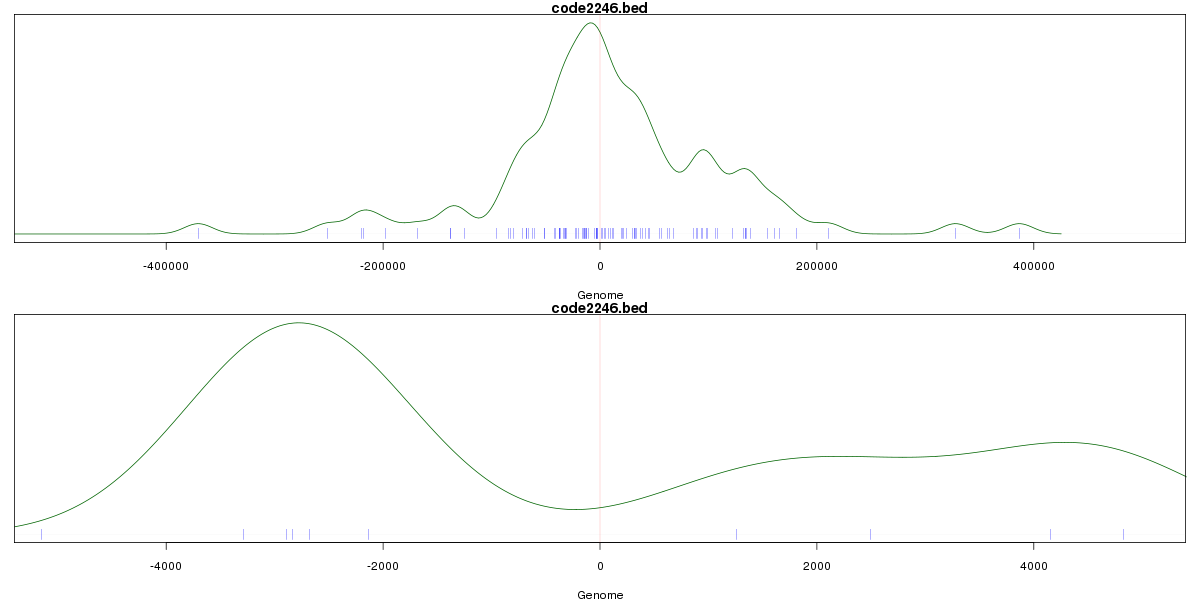
Stats
Number of sites: 181Promoter: 0%
CpG-Island: 0%
Conserved: 32%
Enriched Motifs & Matches
Match Detail: [Jaspar]
|
| ||
|---|---|---|
| Sites: 57/100 | e-val: 3e-30 | ||
| Factor | e-val(match) | DB |
| NFE2L2 | 0.00000000015597 | JASPAR |
| AP1 | 0.0000000003192 | JASPAR |
| NFE2L1::MafG | 0.00016075 | JASPAR |
| PPARG | 0.0043572 | JASPAR |
| PBX1 | 0.0046136 | JASPAR |
BED file downloads
Top 10 Example Regions
| Location | Gene Link | Dist. |
|---|---|---|
| chr17: 70657960-70658110 | SLC39A11 | 37.84 |
| chr7: 55177160-55177310 | EGFR | 48.88 |
| chr1: 95087080-95087230 | PGBD4P7 | 55.15 |
| chr1: 95087080-95087230 | F3 | 55.15 |
| chr1: 95087080-95087230 | LINC01057 | 55.15 |
| chr1: 95087080-95087230 | RP11-86H7.7 | 55.15 |
| chr2: 31653080-31653230 | XDH | 56.56 |
| chr10: 98261880-98262030 | TLL2 | 60.2 |
| chr12: 3563405-3563555 | PRMT8 | 65.19 |
| chr6: 41004040-41004190 | ADCY10P1 | 67.18 |