SOM cluster: 2255
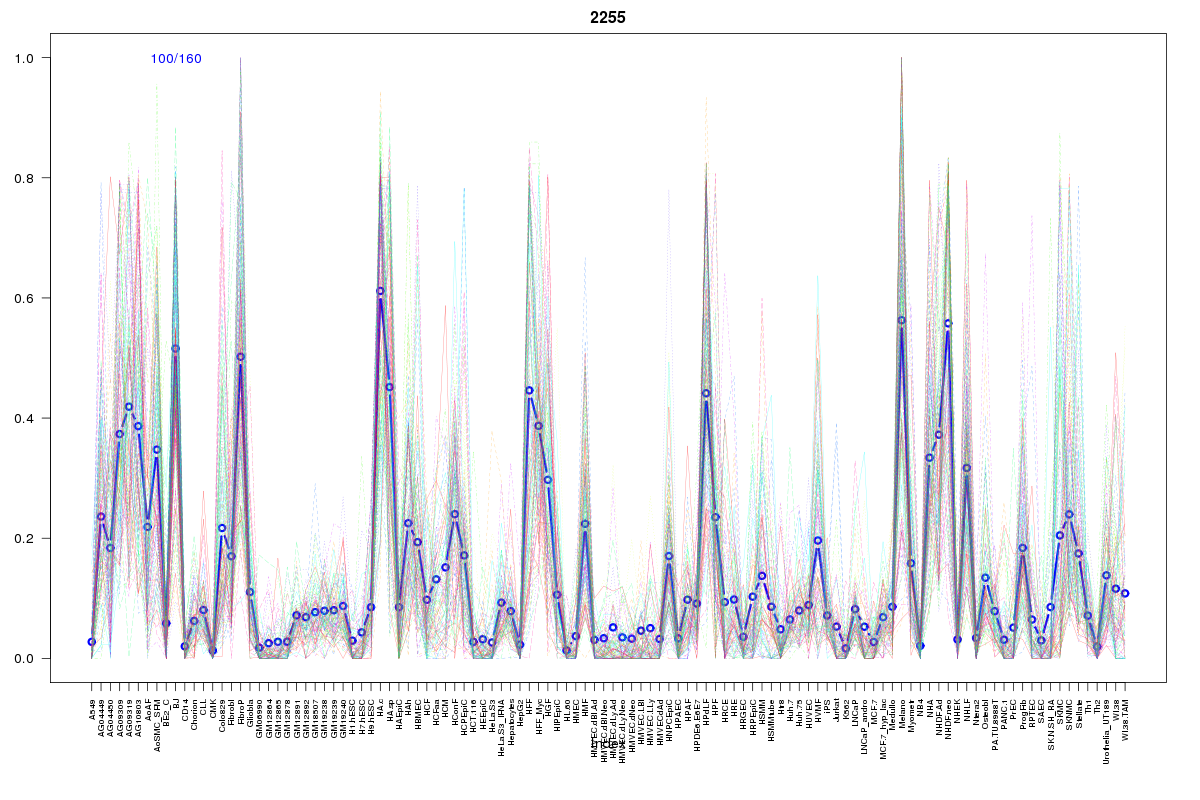
Cluster Hypersensitivity Profile

Genomic Location Trend
These plots show the distribution of the DHS sites surrounding the Transcript Start Site of the nearest gene.
Stats
Number of sites: 160Promoter: 0%
CpG-Island: 0%
Conserved: 76%
Enriched Motifs & Matches
Match Detail: [Jaspar]
|
| ||
|---|---|---|
| Sites: 38/100 | e-val: 0.00071 | ||
| Factor | e-val(match) | DB |
| Foxd3 | 0.00012803 | JASPAR |
| HNF1A | 0.00015816 | JASPAR |
| FOXI1 | 0.00019041 | JASPAR |
| Foxq1 | 0.00024724 | JASPAR |
| MEF2A | 0.00040876 | JASPAR |
BED file downloads
Top 10 Example Regions
| Location | Gene Link | Dist. |
|---|---|---|
| chr1: 202255820-202255970 | UBE2T | 46.79 |
| chr8: 121255380-121255530 | COL14A1 | 47.82 |
| chr3: 188693220-188693370 | TPRG1 | 49.89 |
| chr3: 173340100-173340250 | NLGN1 | 54.4 |
| chr8: 131554340-131554490 | ASAP1 | 58.35 |
| chr1: 99135260-99135410 | SNX7 | 72.94 |
| chr12: 2393720-2393870 | CACNA1C-AS4 | 77.17 |
| chr12: 2393720-2393870 | CACNA1C | 77.17 |
| chr12: 77882060-77882210 | RP1-34H18.1 | 79.25 |
| chr6: 154518420-154518570 | RP11-317B3.2 | 81.4 |