SOM cluster: 227
Cluster Hypersensitivity Profile

Genomic Location Trend
These plots show the distribution of the DHS sites surrounding the Transcript Start Site of the nearest gene.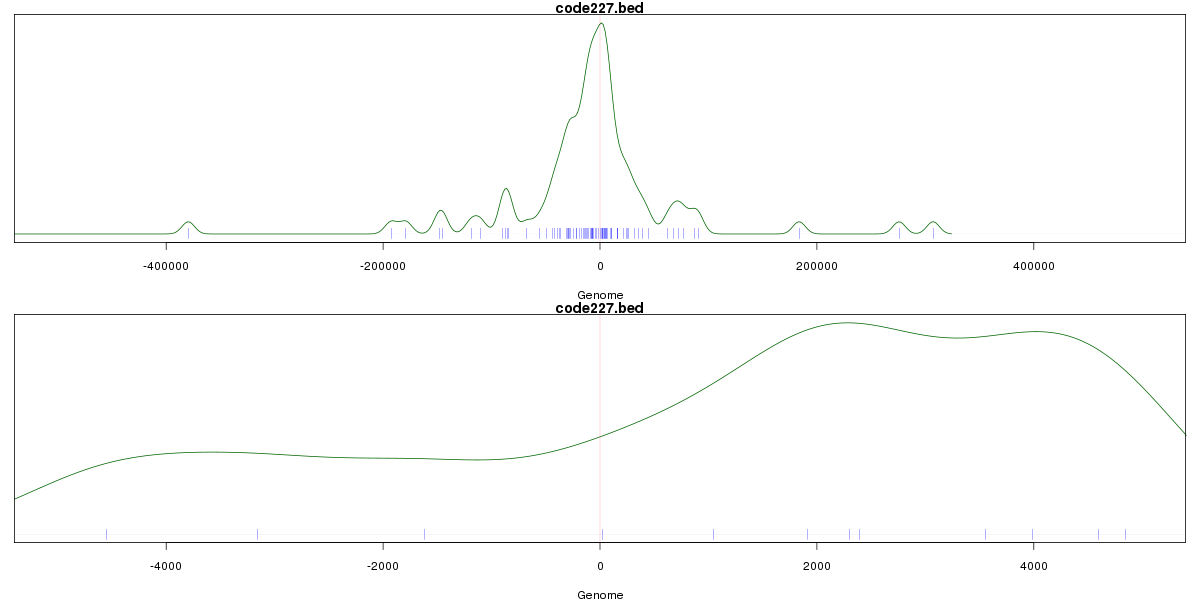
Stats
Number of sites: 83Promoter: 1%
CpG-Island: 0%
Conserved: 35%
Enriched Motifs & Matches
Match Detail: [Jaspar]
|
| ||
|---|---|---|
| Sites: 47/83 | e-val: 6e-28 | ||
| Factor | e-val(match) | DB |
| AP1 | 0.00000000047316 | JASPAR |
| NFE2L2 | 0.0000011127 | JASPAR |
| PBX1 | 0.012258 | JASPAR |
| NFE2L1::MafG | 0.013815 | JASPAR |
| PPARG | 0.018846 | JASPAR |
BED file downloads
Top 10 Example Regions
| Location | Gene Link | Dist. |
|---|---|---|
| chr1: 203738880-203739030 | LAX1 | 28.52 |
| chr17: 28038125-28038275 | SNORA70 | 59.25 |
| chr3: 130539920-130540070 | ATP2C1 | 66.31 |
| chr3: 130539920-130540070 | RP11-39E3.3 | 66.31 |
| chr3: 98232080-98232230 | GPR15 | 72.5 |
| chr3: 98232080-98232230 | RPL38P4 | 72.5 |
| chr17: 74547180-74547330 | ST6GALNAC2 | 73.74 |
| chr1: 116520160-116520310 | SLC22A15 | 75.07 |
| chr8: 37467680-37467830 | RP11-150O12.1 | 76.94 |
| chr2: 43385460-43385610 | ZFP36L2 | 77.52 |