SOM cluster: 229
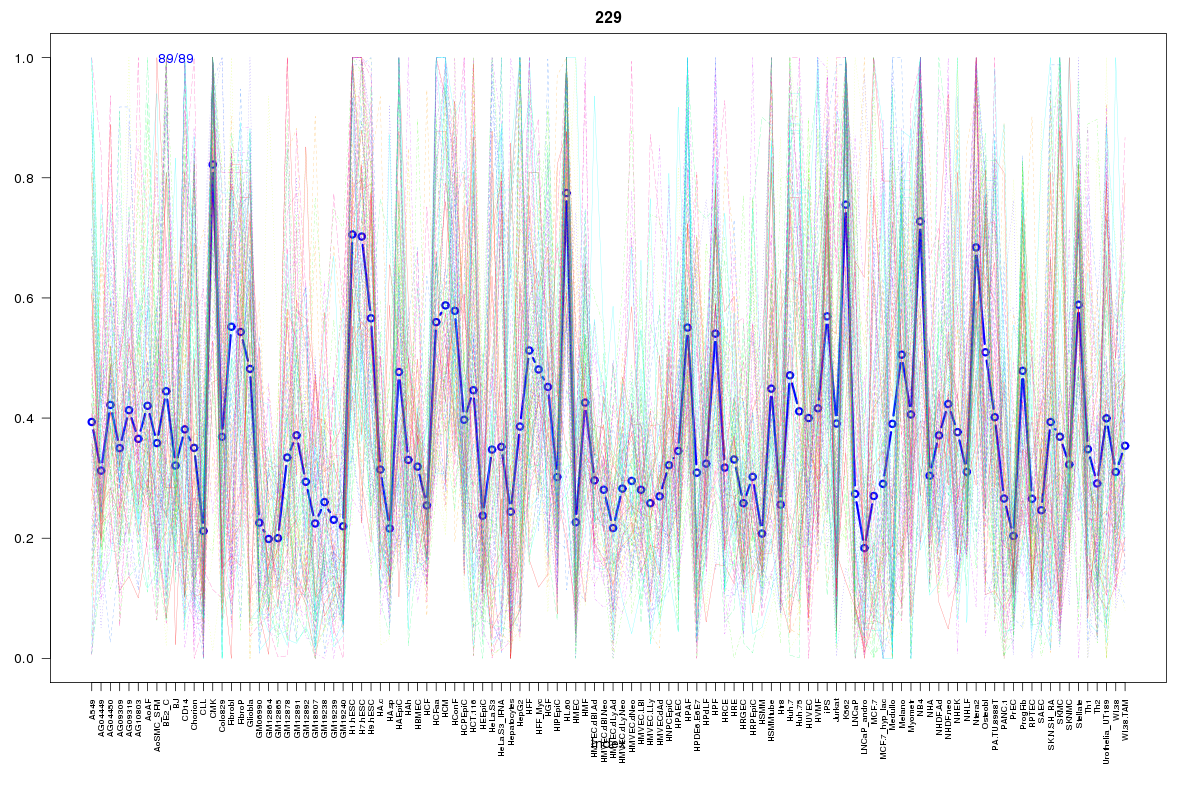
Cluster Hypersensitivity Profile

Genomic Location Trend
These plots show the distribution of the DHS sites surrounding the Transcript Start Site of the nearest gene.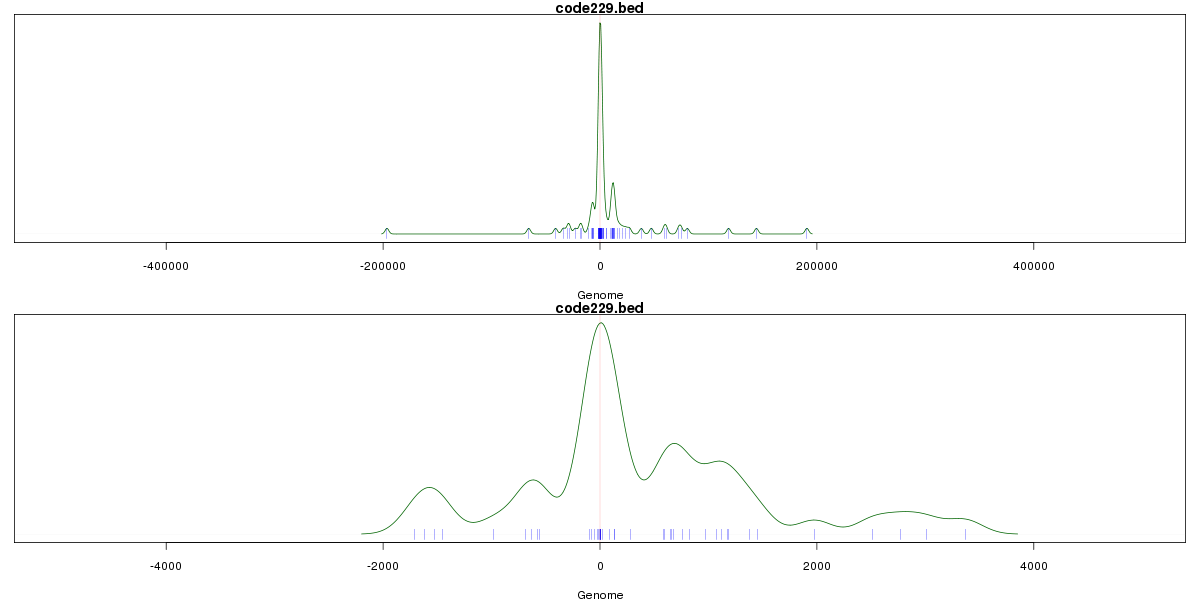
Stats
Number of sites: 89Promoter: 26%
CpG-Island: 17%
Conserved: 46%
Enriched Motifs & Matches
Match Detail: [Jaspar]
|
| ||
|---|---|---|
| Sites: 70/89 | e-val: 0 | ||
| Factor | e-val(match) | DB |
| SP1 | 0.0000000076081 | JASPAR |
| Pax4 | 0.0000069753 | JASPAR |
| EWSR1-FLI1 | 0.00020638 | JASPAR |
| RREB1 | 0.0014656 | JASPAR |
| PLAG1 | 0.0026237 | JASPAR |
|
| ||
| Sites: 29/89 | e-val: 0.042 | ||
| Factor | e-val(match) | DB |
| SP1 | 0.0000000000044658 | JASPAR |
| MZF1_1-4 | 0.000095222 | JASPAR |
| Klf4 | 0.00014527 | JASPAR |
| Pax4 | 0.00080631 | JASPAR |
| RREB1 | 0.0027459 | JASPAR |
BED file downloads
Top 10 Example Regions
| Location | Gene Link | Dist. |
|---|---|---|
| chr1: 151032740-151032890 | MLLT11 | 12.8 |
| chr22: 38430320-38430470 | MICALL1 | 70.27 |
| chr22: 38430320-38430470 | RP5-1039K5.16 | 70.27 |
| chr1: 182558280-182558430 | RNASEL | 74.12 |
| chr11: 73372400-73372550 | RAB6A | 75.93 |
| chr11: 73372400-73372550 | HMGN2P38 | 75.93 |
| chr9: 131487385-131487535 | VTI1BP4 | 79.14 |
| chr6: 28979180-28979330 | OR2J1 | 83.95 |
| chr6: 28979180-28979330 | KRT18P1 | 83.95 |
| chr16: 31463100-31463250 | ITGAX | 90.91 |