SOM cluster: 2292
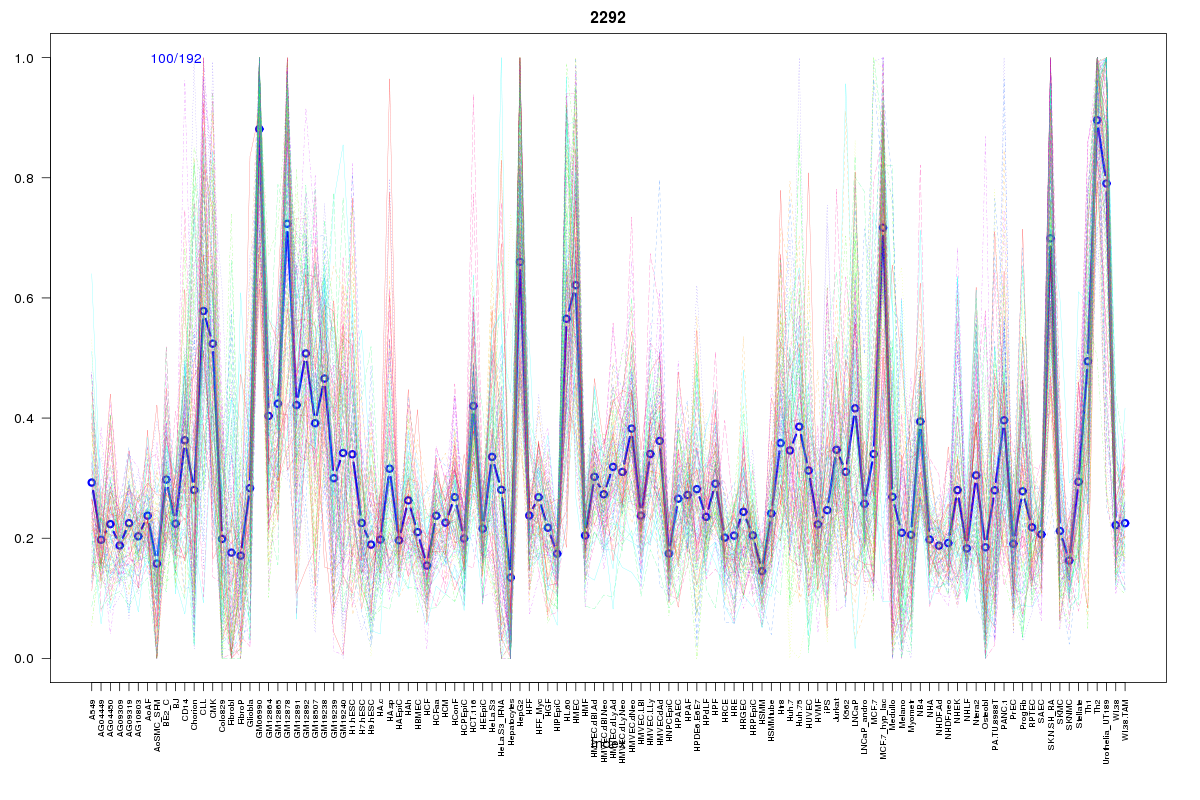
Cluster Hypersensitivity Profile

Genomic Location Trend
These plots show the distribution of the DHS sites surrounding the Transcript Start Site of the nearest gene.
Stats
Number of sites: 192Promoter: 41%
CpG-Island: 92%
Conserved: 67%
Enriched Motifs & Matches
Match Detail: [Jaspar]
|
| ||
|---|---|---|
| Sites: 94/100 | e-val: 0 | ||
| Factor | e-val(match) | DB |
| SP1 | 0.0000000034334 | JASPAR |
| PLAG1 | 0.000042523 | JASPAR |
| TFAP2A | 0.00095531 | JASPAR |
| Klf4 | 0.004943 | JASPAR |
| Pax4 | 0.023088 | JASPAR |
|
| ||
| Sites: 86/100 | e-val: 0.0000012 | ||
| Factor | e-val(match) | DB |
| SP1 | 0.00031182 | JASPAR |
| TFAP2A | 0.00069169 | JASPAR |
| NHLH1 | 0.0046647 | JASPAR |
| Myf | 0.014158 | JASPAR |
| Zfx | 0.019603 | JASPAR |
BED file downloads
Top 10 Example Regions
| Location | Gene Link | Dist. |
|---|---|---|
| chr11: 14913480-14913630 | CYP2R1 | 38.98 |
| chr19: 12721860-12722010 | WDR83OS | 49.39 |
| chr19: 12721860-12722010 | WDR83 | 49.39 |
| chr19: 12721860-12722010 | DHPS | 49.39 |
| chr19: 12721860-12722010 | ZNF791 | 49.39 |
| chr19: 12721860-12722010 | MAN2B1 | 49.39 |
| chr8: 128750880-128751030 | CASC11 | 50.41 |
| chr8: 128750880-128751030 | PVT1 | 50.41 |
| chr12: 8234985-8235135 | FAM66C | 54.15 |
| chr7: 112090565-112090715 | MTND5P8 | 54.24 |