SOM cluster: 2294
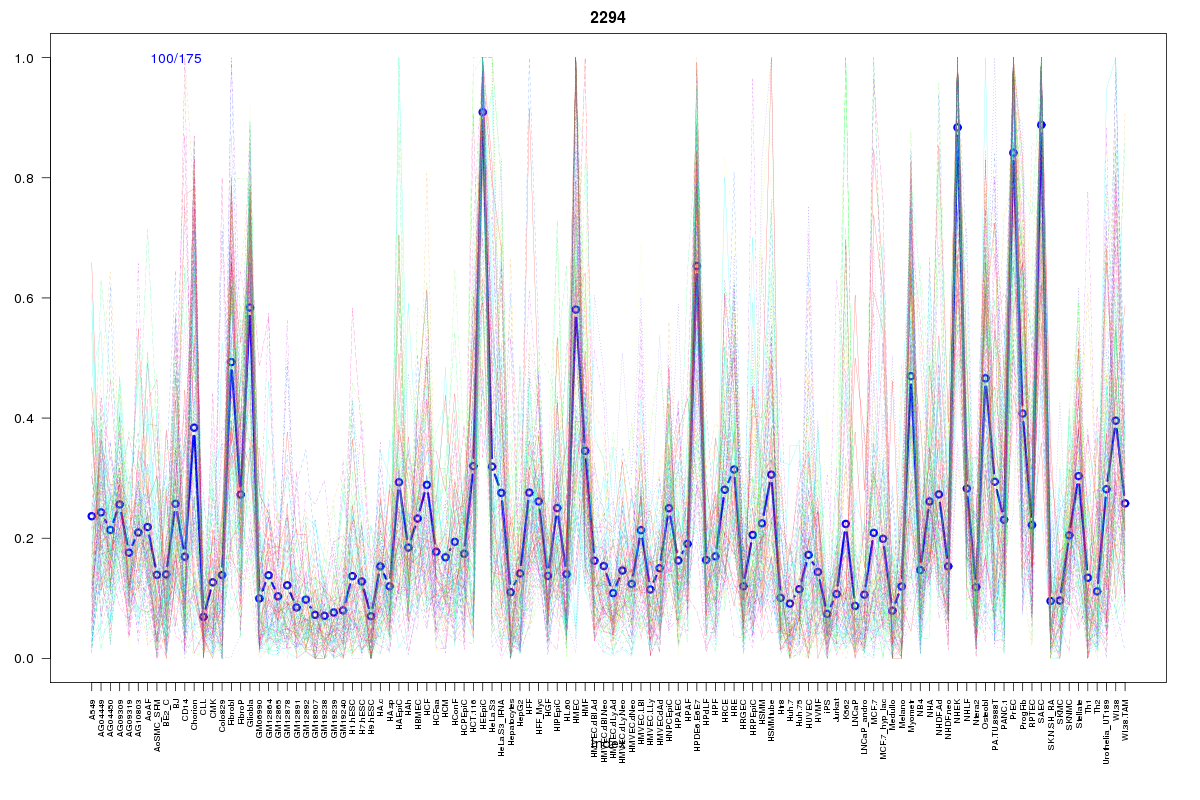
Cluster Hypersensitivity Profile

Genomic Location Trend
These plots show the distribution of the DHS sites surrounding the Transcript Start Site of the nearest gene.
Stats
Number of sites: 175Promoter: 11%
CpG-Island: 1%
Conserved: 33%
Enriched Motifs & Matches
Match Detail: [Jaspar]
|
| ||
|---|---|---|
| Sites: 47/100 | e-val: 3.3e-25 | ||
| Factor | e-val(match) | DB |
| NFE2L2 | 0.0000000000036952 | JASPAR |
| AP1 | 0.0000000005934 | JASPAR |
| NFE2L1::MafG | 0.0027414 | JASPAR |
| PPARG | 0.0044607 | JASPAR |
| Foxa2 | 0.0046614 | JASPAR |
|
| ||
| Sites: 36/100 | e-val: 0.0016 | ||
| Factor | e-val(match) | DB |
| Klf4 | 0.0000000024122 | JASPAR |
| RREB1 | 0.0000022888 | JASPAR |
| Pax4 | 0.0000059684 | JASPAR |
| SP1 | 0.00010104 | JASPAR |
| Tal1::Gata1 | 0.00037326 | JASPAR |
BED file downloads
Top 10 Example Regions
| Location | Gene Link | Dist. |
|---|---|---|
| chr1: 156661560-156661710 | CRABP2 | 38.62 |
| chr17: 18139425-18139575 | RPL21P121 | 39.03 |
| chr17: 18139425-18139575 | snoU13 | 39.03 |
| chr17: 18139425-18139575 | LLGL1 | 39.03 |
| chr17: 18139425-18139575 | FLII | 39.03 |
| chr3: 126724800-126724950 | PLXNA1 | 41.43 |
| chr8: 96237880-96238030 | KB-1047C11.2 | 55.38 |
| chr3: 194860685-194860835 | XXYLT1-AS2 | 65.09 |
| chr8: 11645680-11645830 | CTSB | 65.54 |
| chr16: 31129745-31129895 | KAT8 | 65.87 |