SOM cluster: 2303
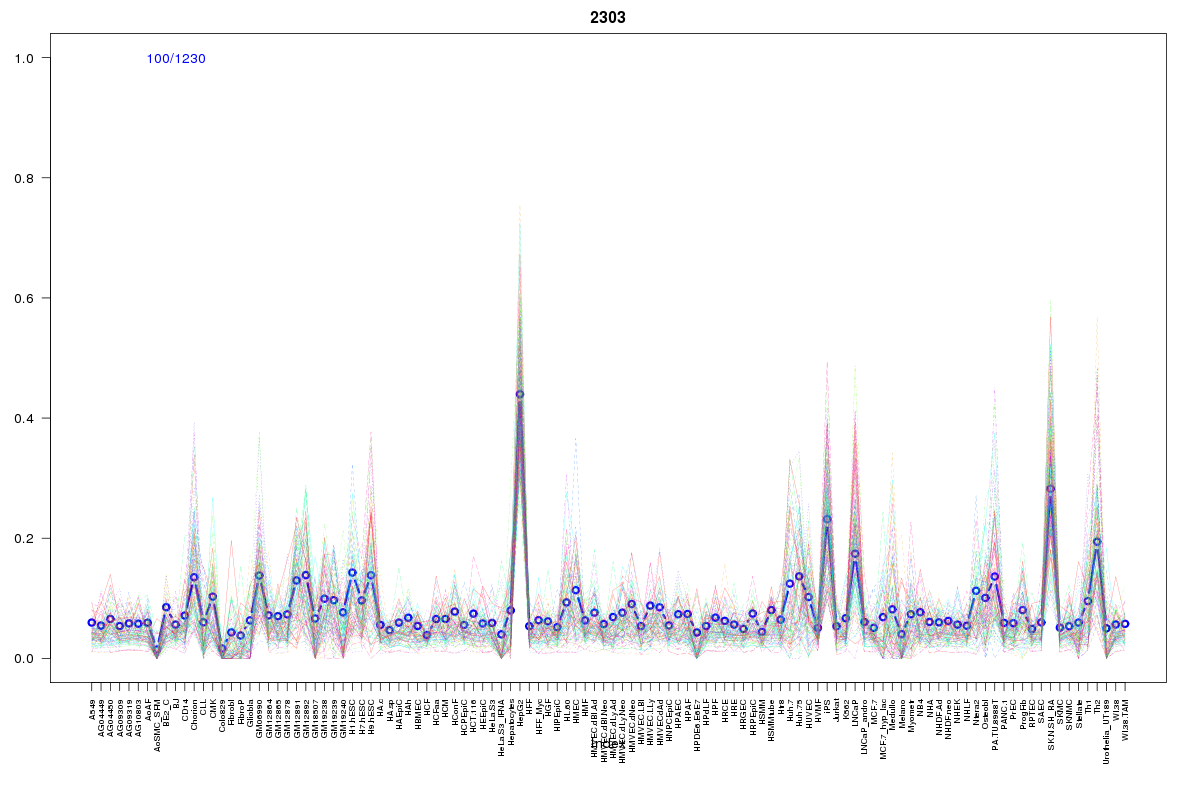
Cluster Hypersensitivity Profile

Genomic Location Trend
These plots show the distribution of the DHS sites surrounding the Transcript Start Site of the nearest gene.
Stats
Number of sites: 1230Promoter: 17%
CpG-Island: 55%
Conserved: 64%
Enriched Motifs & Matches
Match Detail: [Jaspar]
|
| ||
|---|---|---|
| Sites: 70/100 | e-val: 0 | ||
| Factor | e-val(match) | DB |
| SP1 | 0.000000000083024 | JASPAR |
| RREB1 | 0.00018743 | JASPAR |
| Egr1 | 0.00053573 | JASPAR |
| Klf4 | 0.00077684 | JASPAR |
| TFAP2A | 0.00082147 | JASPAR |
|
| ||
| Sites: 47/100 | e-val: 0.00000053 | ||
| Factor | e-val(match) | DB |
| SP1 | 0.00000000011701 | JASPAR |
| Klf4 | 0.00001118 | JASPAR |
| Pax5 | 0.0035914 | JASPAR |
| TFAP2A | 0.0062511 | JASPAR |
| INSM1 | 0.018193 | JASPAR |
BED file downloads
Top 10 Example Regions
| Location | Gene Link | Dist. |
|---|---|---|
| chr3: 48609485-48609635 | SLC26A6 | 34.6 |
| chr1: 1168340-1168490 | RP11-465B22.5 | 40.2 |
| chr1: 805425-805575 | LINC00115 | 47.09 |
| chrX: 48693705-48693855 | PCSK1N | 48.41 |
| chr9: 132382880-132383030 | RP11-483H20.6 | 48.53 |
| chr2: 177053685-177053835 | HOXD1 | 49.01 |
| chr2: 177053685-177053835 | AC009336.24 | 49.01 |
| chr2: 177053685-177053835 | HOXD3 | 49.01 |
| chr2: 177053685-177053835 | HOXD9 | 49.01 |
| chr2: 177053685-177053835 | HOXD-AS1 | 49.01 |