SOM cluster: 2336
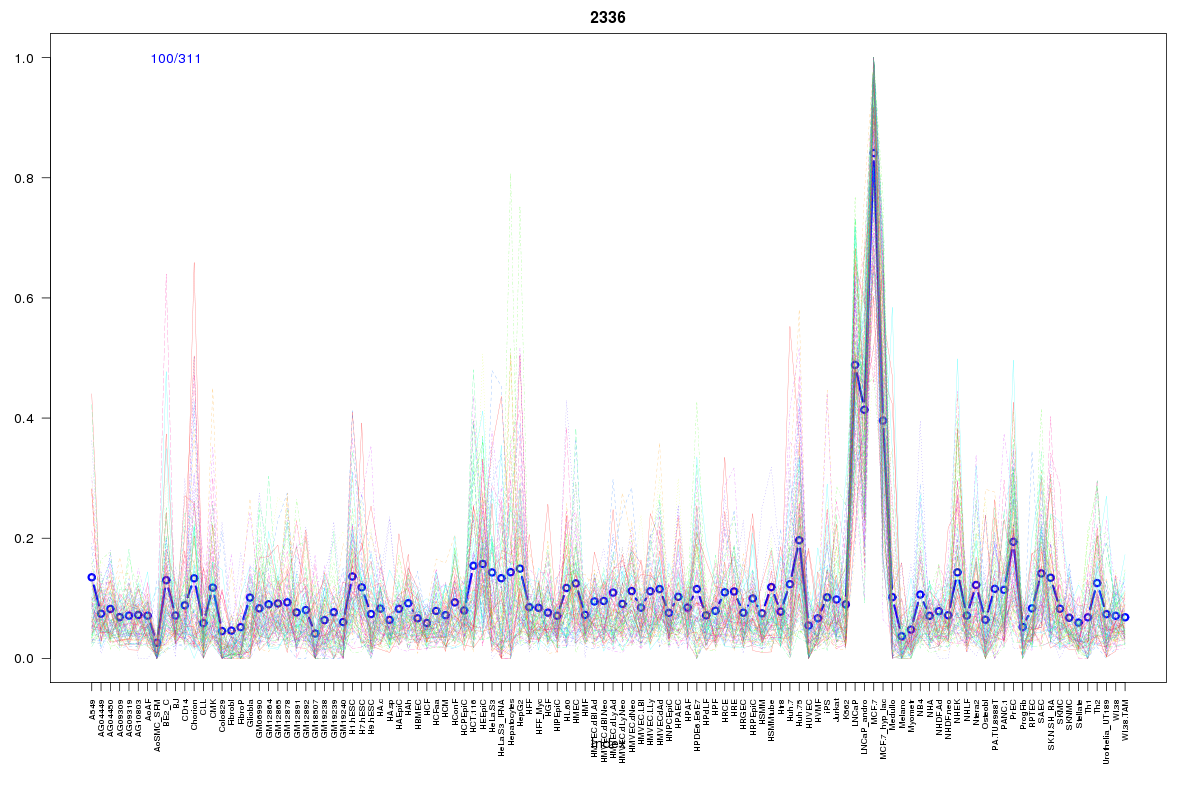
Cluster Hypersensitivity Profile

Genomic Location Trend
These plots show the distribution of the DHS sites surrounding the Transcript Start Site of the nearest gene.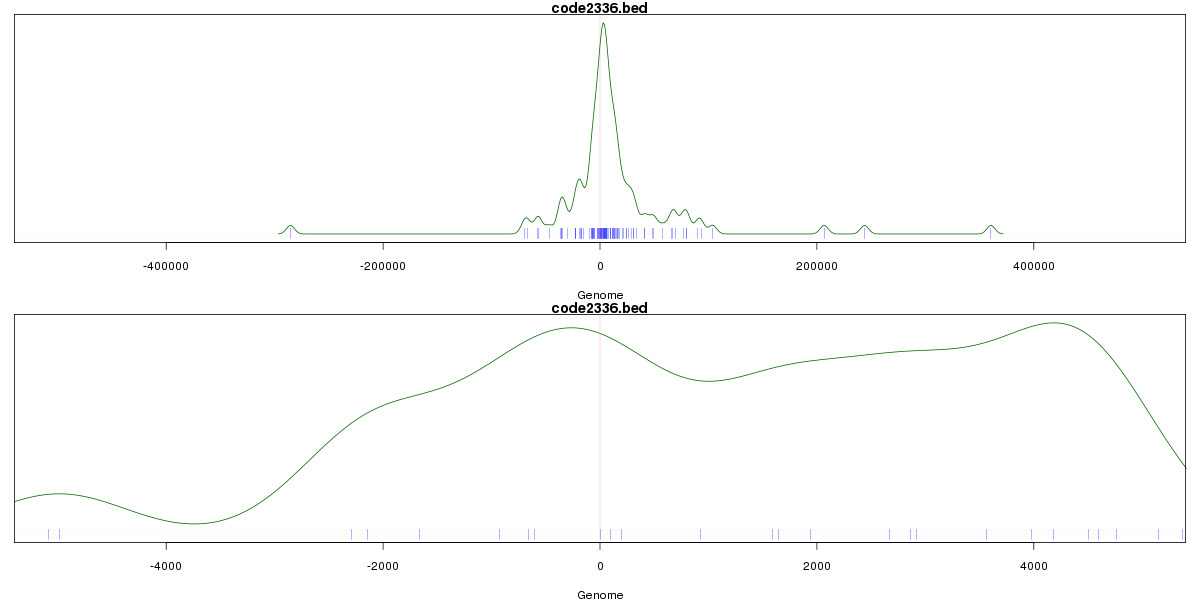
Stats
Number of sites: 311Promoter: 6%
CpG-Island: 1%
Conserved: 32%
Enriched Motifs & Matches
Match Detail: [Jaspar]
|
| ||
|---|---|---|
| Sites: 47/100 | e-val: 5.6e-24 | ||
| Factor | e-val(match) | DB |
| Klf4 | 0.0000068081 | JASPAR |
| SP1 | 0.00016137 | JASPAR |
| Pax4 | 0.00017269 | JASPAR |
| RREB1 | 0.0005494 | JASPAR |
| ESR1 | 0.0043649 | JASPAR |
|
| ||
| Sites: 67/100 | e-val: 4.5e-18 | ||
| Factor | e-val(match) | DB |
| ESR1 | 0.0006077 | JASPAR |
| SP1 | 0.0020094 | JASPAR |
| TP53 | 0.0038472 | JASPAR |
| PPARG::RXRA | 0.0056639 | JASPAR |
| ESR2 | 0.026495 | JASPAR |
|
| ||
| Sites: 39/100 | e-val: 0.013 | ||
| Factor | e-val(match) | DB |
| Stat3 | 0.00027781 | JASPAR |
| Egr1 | 0.00057905 | JASPAR |
| SP1 | 0.00098863 | JASPAR |
| EBF1 | 0.0013781 | JASPAR |
| PLAG1 | 0.0018089 | JASPAR |
|
| ||
| Sites: 19/100 | e-val: 1.9 | ||
| Factor | e-val(match) | DB |
| INSM1 | 0.00016981 | JASPAR |
| PLAG1 | 0.0060876 | JASPAR |
| Klf4 | 0.0071058 | JASPAR |
| TFAP2A | 0.0081362 | JASPAR |
| SP1 | 0.0099875 | JASPAR |
BED file downloads
Top 10 Example Regions
| Location | Gene Link | Dist. |
|---|---|---|
| chr17: 76222905-76223055 | SYNGR2 | 44.79 |
| chr1: 161008045-161008195 | PVRL4 | 44.8 |
| chr1: 161008045-161008195 | F11R | 44.8 |
| chr1: 161008045-161008195 | TSTD1 | 44.8 |
| chr1: 156123405-156123555 | RAB25 | 46.51 |
| chr8: 128878120-128878270 | PVT1 | 50.94 |
| chr4: 3463045-3463275 | DOK7 | 52.87 |
| chr11: 117799925-117800075 | TMPRSS13 | 56.46 |
| chr12: 48358085-48358235 | TMEM106C | 58.67 |
| chr7: 134129000-134129150 | AKR1B1 | 58.84 |