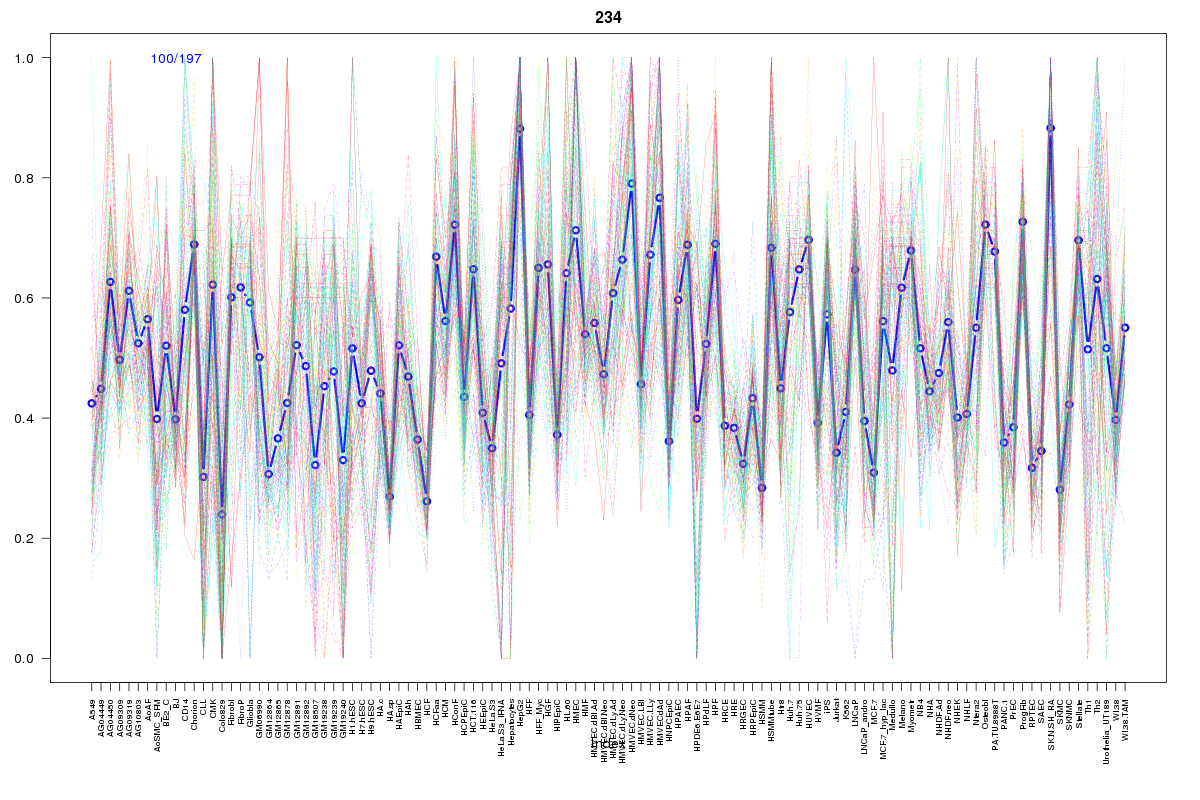
SOM cluster: 234
Cluster Hypersensitivity Profile

Genomic Location Trend
These plots show the distribution of the DHS sites surrounding the Transcript Start Site of the nearest gene.
Stats
Number of sites: 197Promoter: 60%
CpG-Island: 86%
Conserved: 80%
Enriched Motifs & Matches
Match Detail: [Jaspar]
|
| ||
|---|---|---|
| Sites: 91/100 | e-val: 0 | ||
| Factor | e-val(match) | DB |
| SP1 | 0.00000025085 | JASPAR |
| TFAP2A | 0.00026767 | JASPAR |
| Egr1 | 0.0067963 | JASPAR |
| Klf4 | 0.012618 | JASPAR |
| NHLH1 | 0.021455 | JASPAR |
|
| ||
| Sites: 68/100 | e-val: 2.09999e-41 | ||
| Factor | e-val(match) | DB |
| SP1 | 0.0000063058 | JASPAR |
| TFAP2A | 0.000043212 | JASPAR |
| PLAG1 | 0.00019292 | JASPAR |
| Zfx | 0.022718 | JASPAR |
| Egr1 | 0.041715 | JASPAR |
|
| ||
| Sites: 55/100 | e-val: 0.5 | ||
| Factor | e-val(match) | DB |
| SP1 | 0.00002604 | JASPAR |
| TFAP2A | 0.0039694 | JASPAR |
| NHLH1 | 0.014813 | JASPAR |
| SPIB | 0.023741 | JASPAR |
| Myf | 0.02457 | JASPAR |
BED file downloads
Top 10 Example Regions
| Location | Gene Link | Dist. |
|---|---|---|
| chr10: 22609945-22610095 | BMI1 | 32.09 |
| chr10: 22609945-22610095 | RP11-573G6.2 | 32.09 |
| chr2: 8819300-8819450 | ID2 | 44.84 |
| chr11: 67210925-67211075 | PITPNM1 | 46.73 |
| chr11: 67210925-67211075 | POLD4 | 46.73 |
| chrX: 2847340-2847490 | ARSD | 50.81 |
| chr21: 47401620-47401770 | PCBP3 | 52.54 |
| chr15: 96900480-96900630 | NR2F2 | 56.26 |
| chr15: 96900480-96900630 | RP11-522B15.3 | 56.26 |
| chr16: 447760-447910 | AXIN1 | 58.93 |