SOM cluster: 2349
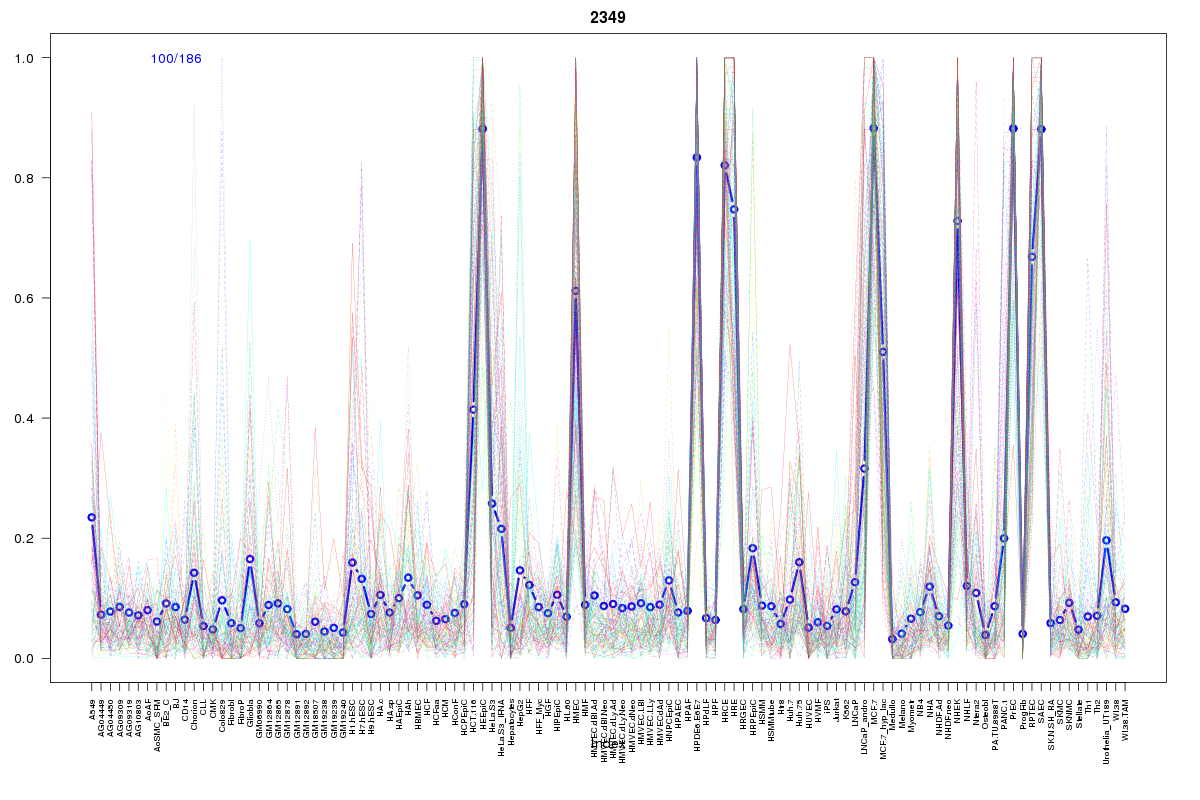
Cluster Hypersensitivity Profile

Genomic Location Trend
These plots show the distribution of the DHS sites surrounding the Transcript Start Site of the nearest gene.
Stats
Number of sites: 186Promoter: 3%
CpG-Island: 0%
Conserved: 45%
Enriched Motifs & Matches
Match Detail: [Jaspar]
|
| ||
|---|---|---|
| Sites: 38/100 | e-val: 1.9e-16 | ||
| Factor | e-val(match) | DB |
| AP1 | 0.00000000047693 | JASPAR |
| NFE2L2 | 0.0000000066432 | JASPAR |
| PPARG | 0.0019678 | JASPAR |
| NFE2L1::MafG | 0.023922 | JASPAR |
| Pax2 | 0.06471 | JASPAR |
BED file downloads
Top 10 Example Regions
| Location | Gene Link | Dist. |
|---|---|---|
| chr12: 93516600-93516750 | RP11-511B23.3 | 40.48 |
| chr11: 72905720-72905870 | P2RY2 | 50.47 |
| chr8: 120217440-120217590 | MAL2 | 55.92 |
| chr11: 119461440-119461590 | PVRL1 | 59.63 |
| chr17: 4396340-4396490 | GGT6 | 63.08 |
| chr17: 4396340-4396490 | SPNS2 | 63.08 |
| chr3: 161009420-161009570 | SPTSSB | 66.2 |
| chr4: 99087680-99087830 | RP11-323J4.1 | 70.4 |
| chr16: 84430280-84430430 | ATP2C2 | 70.81 |
| chr10: 13750820-13750970 | FRMD4A | 74.04 |