SOM cluster: 2352
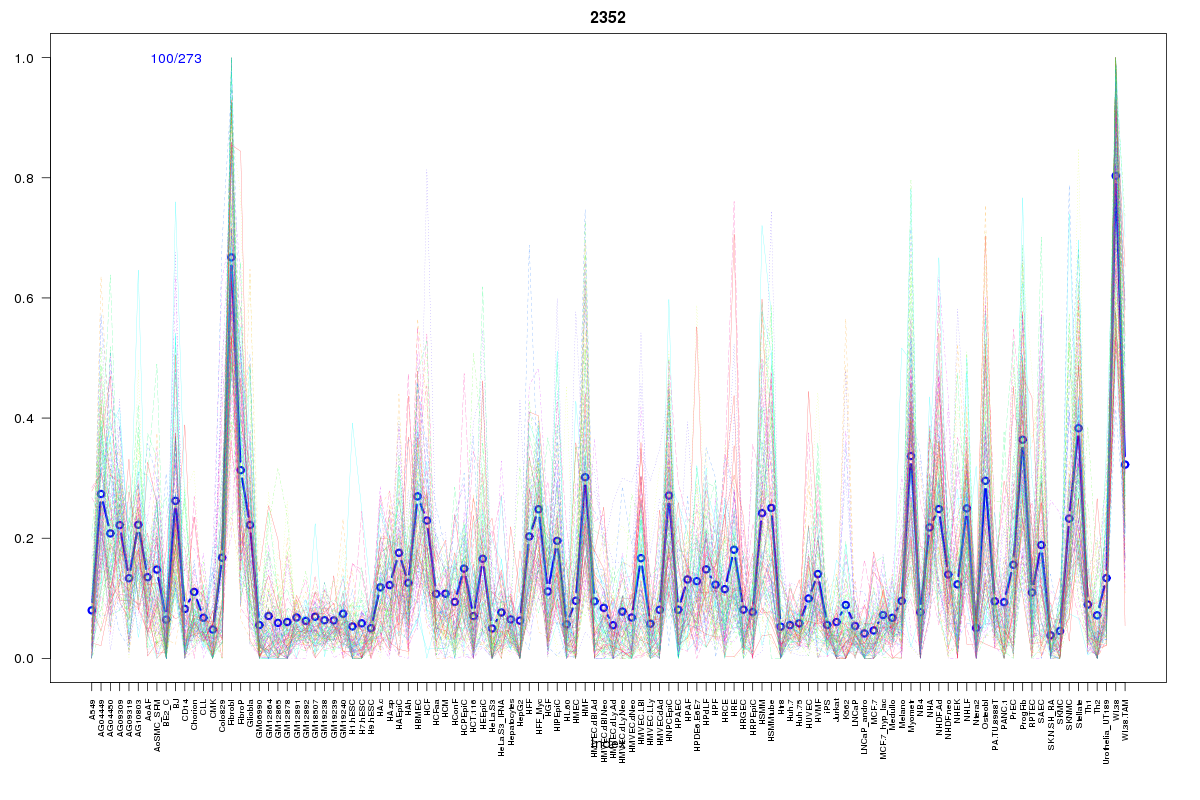
Cluster Hypersensitivity Profile

Genomic Location Trend
These plots show the distribution of the DHS sites surrounding the Transcript Start Site of the nearest gene.
Stats
Number of sites: 273Promoter: 0%
CpG-Island: 0%
Conserved: 21%
Enriched Motifs & Matches
Match Detail: [Jaspar]
|
| ||
|---|---|---|
| Sites: 55/100 | e-val: 3.5e-19 | ||
| Factor | e-val(match) | DB |
| AP1 | 0.000000000046041 | JASPAR |
| NFE2L2 | 0.0000000049242 | JASPAR |
| PPARG | 0.0038758 | JASPAR |
| NFE2L1::MafG | 0.0044009 | JASPAR |
| Foxa2 | 0.01149 | JASPAR |
BED file downloads
Top 10 Example Regions
| Location | Gene Link | Dist. |
|---|---|---|
| chr10: 6363965-6364115 | PFKFB3 | 24.75 |
| chr2: 165563045-165563195 | AC019181.3 | 56.25 |
| chr21: 33293540-33293690 | HUNK-AS1 | 57.06 |
| chr9: 116395180-116395330 | RP11-168K11.2 | 58.05 |
| chr7: 43686380-43686530 | COA1 | 60.92 |
| chr7: 43686380-43686530 | HECW1 | 60.92 |
| chr19: 47610260-47610410 | NPAS1 | 61.82 |
| chr8: 120084360-120084510 | MAL2 | 62.89 |
| chr2: 239729700-239729850 | AC144525.1 | 63.71 |
| chr5: 76722580-76722730 | WDR41 | 65.45 |