SOM cluster: 2354
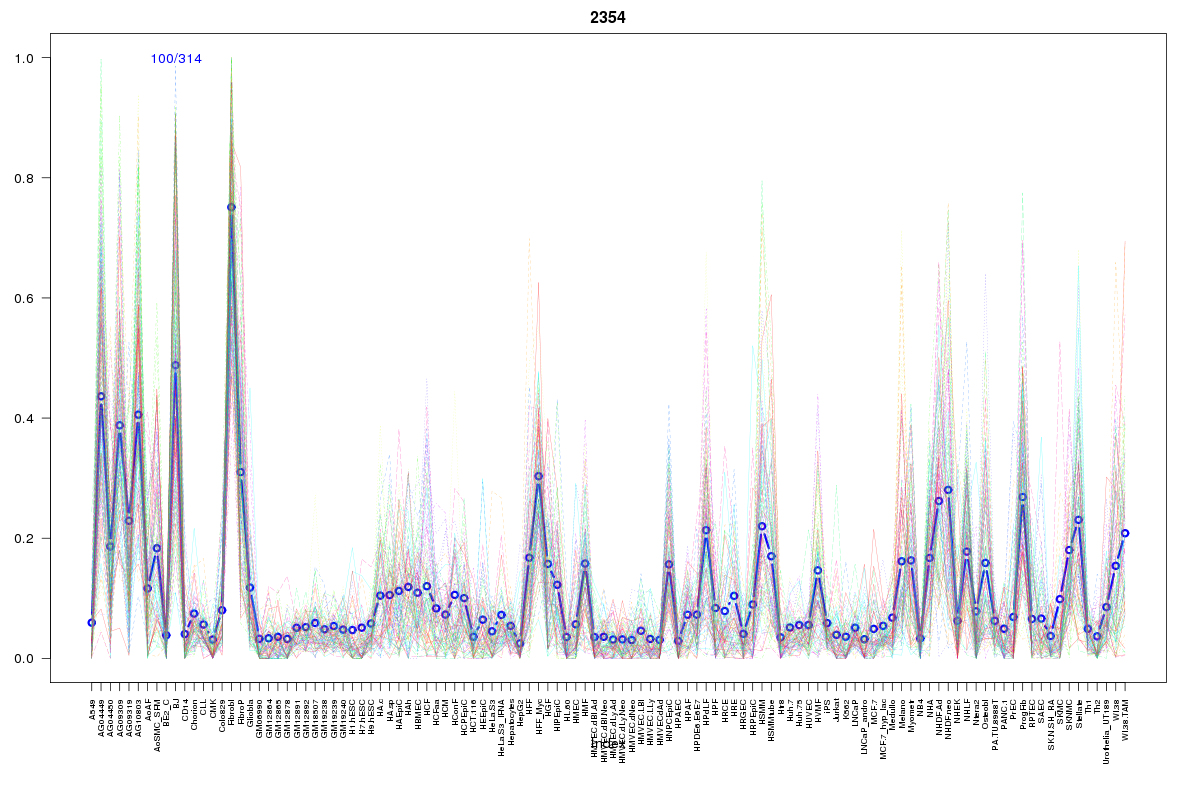
Cluster Hypersensitivity Profile

Genomic Location Trend
These plots show the distribution of the DHS sites surrounding the Transcript Start Site of the nearest gene.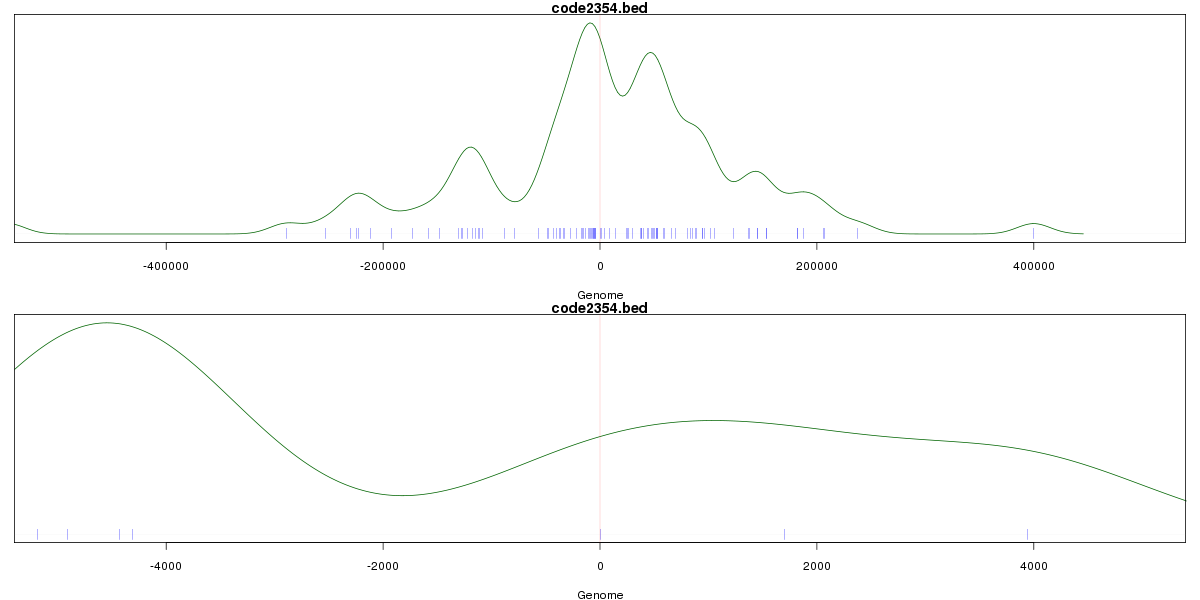
Stats
Number of sites: 314Promoter: 1%
CpG-Island: 0%
Conserved: 42%
Enriched Motifs & Matches
Match Detail: [Jaspar]
|
| ||
|---|---|---|
| Sites: 38/100 | e-val: 0.000000008 | ||
| Factor | e-val(match) | DB |
| Foxq1 | 0.000022153 | JASPAR |
| Lhx3 | 0.00068309 | JASPAR |
| ARID3A | 0.0029158 | JASPAR |
| NKX3-1 | 0.012429 | JASPAR |
| Pdx1 | 0.016493 | JASPAR |
|
| ||
| Sites: 25/100 | e-val: 0.00067 | ||
| Factor | e-val(match) | DB |
| AP1 | 0.00014923 | JASPAR |
| NFE2L2 | 0.0012341 | JASPAR |
| Evi1 | 0.0015777 | JASPAR |
| NFE2L1::MafG | 0.023646 | JASPAR |
| NR4A2 | 0.030776 | JASPAR |
BED file downloads
Top 10 Example Regions
| Location | Gene Link | Dist. |
|---|---|---|
| chr13: 98750880-98751030 | FARP1 | 33.08 |
| chr9: 137483465-137483615 | COL5A1 | 42.99 |
| chr20: 4805065-4805215 | PRNT | 48.38 |
| chr8: 70401460-70401610 | SULF1 | 53.44 |
| chr19: 34619900-34620050 | LSM14A | 54.46 |
| chr2: 218575165-218575315 | AC009469.1 | 59.05 |
| chr5: 134707800-134707950 | CTB-138E5.1 | 59.3 |
| chr4: 40914620-40914770 | RNA5SP160 | 61.76 |
| chr11: 119316700-119316850 | THY1 | 63.73 |
| chr8: 23188380-23188530 | RP11-177H13.2 | 63.81 |