SOM cluster: 2355
Cluster Hypersensitivity Profile

Genomic Location Trend
These plots show the distribution of the DHS sites surrounding the Transcript Start Site of the nearest gene.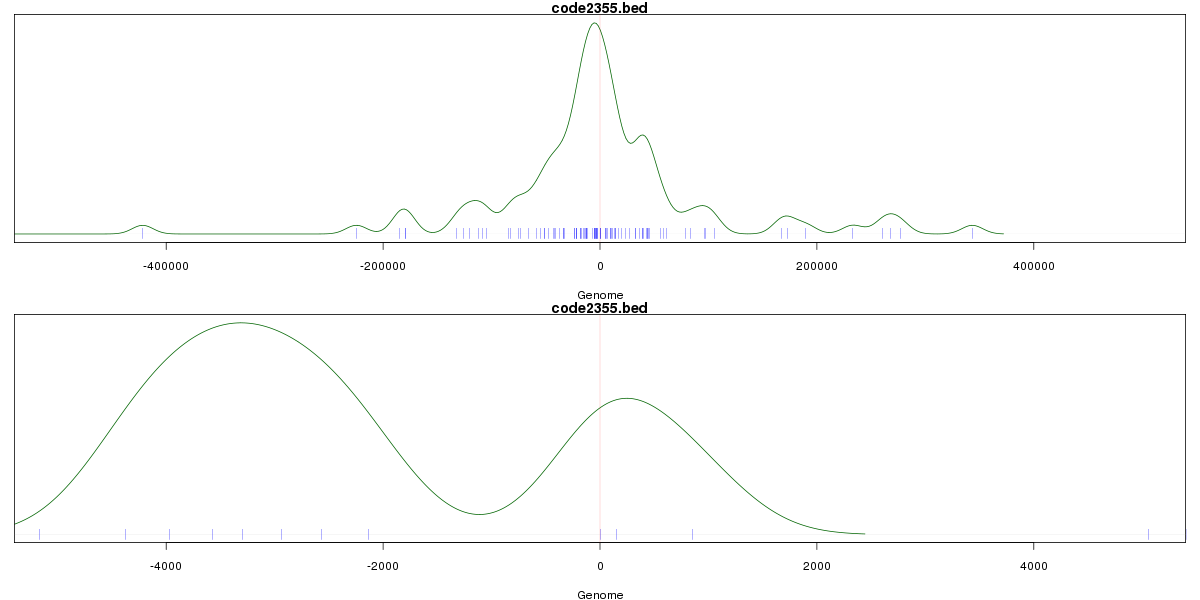
Stats
Number of sites: 282Promoter: 1%
CpG-Island: 0%
Conserved: 41%
Enriched Motifs & Matches
No motifs found.BED file downloads
Top 10 Example Regions
| Location | Gene Link | Dist. |
|---|---|---|
| chr4: 55526900-55527050 | KIT | 53.71 |
| chrX: 7057205-7057355 | STS | 55.47 |
| chr7: 30891405-30891555 | AQP1 | 58.05 |
| chr20: 55265040-55265190 | TFAP2C | 58.47 |
| chr11: 72397980-72398130 | STARD10 | 59.55 |
| chr11: 126761560-126761710 | KIRREL3 | 60.33 |
| chr11: 126761560-126761710 | RP11-688I9.4 | 60.33 |
| chr22: 36983880-36984030 | EIF3D | 66.46 |
| chr13: 33687040-33687190 | STARD13 | 67.65 |
| chr13: 33687040-33687190 | STARD13-IT1 | 67.65 |