SOM cluster: 2365
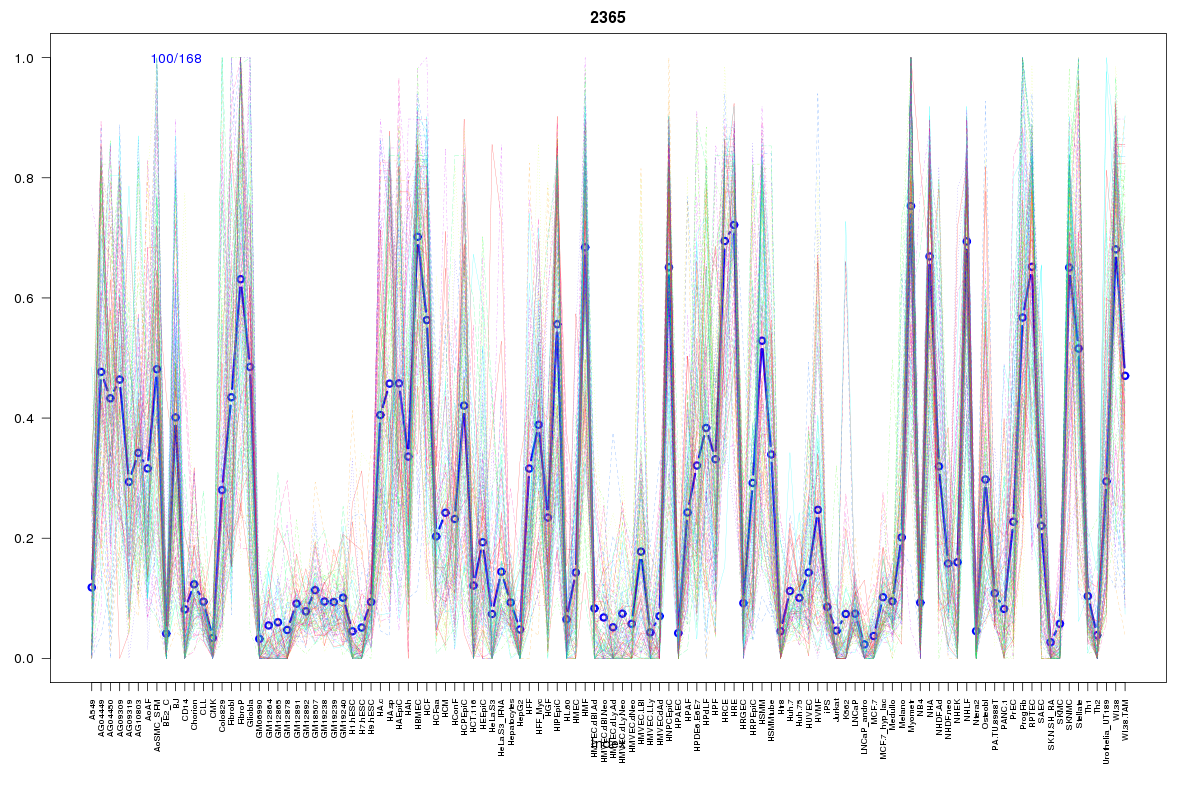
Cluster Hypersensitivity Profile

Genomic Location Trend
These plots show the distribution of the DHS sites surrounding the Transcript Start Site of the nearest gene.
Stats
Number of sites: 168Promoter: 0%
CpG-Island: 0%
Conserved: 35%
Enriched Motifs & Matches
Match Detail: [Jaspar]
|
| ||
|---|---|---|
| Sites: 56/100 | e-val: 9.9e-29 | ||
| Factor | e-val(match) | DB |
| AP1 | 0.000000000012274 | JASPAR |
| NFE2L2 | 0.000000011343 | JASPAR |
| PPARG | 0.0036912 | JASPAR |
| NFE2L1::MafG | 0.0077768 | JASPAR |
| PBX1 | 0.0087548 | JASPAR |
BED file downloads
Top 10 Example Regions
| Location | Gene Link | Dist. |
|---|---|---|
| chr7: 137367520-137367670 | DGKI | 40.06 |
| chr2: 219989905-219990055 | RN7SL764P | 55.39 |
| chr3: 8879000-8879150 | OXTR | 59.25 |
| chr3: 8879000-8879150 | CAV3 | 59.25 |
| chr11: 130668105-130668255 | SNX19 | 61.36 |
| chr11: 68310100-68310250 | PPP6R3 | 61.68 |
| chr11: 12160125-12160275 | MICAL2 | 62.31 |
| chr5: 37793160-37793310 | GDNF | 68.56 |
| chr20: 11795020-11795170 | BTBD3 | 68.81 |
| chr1: 112106380-112106530 | C1orf162 | 69.53 |