SOM cluster: 2366
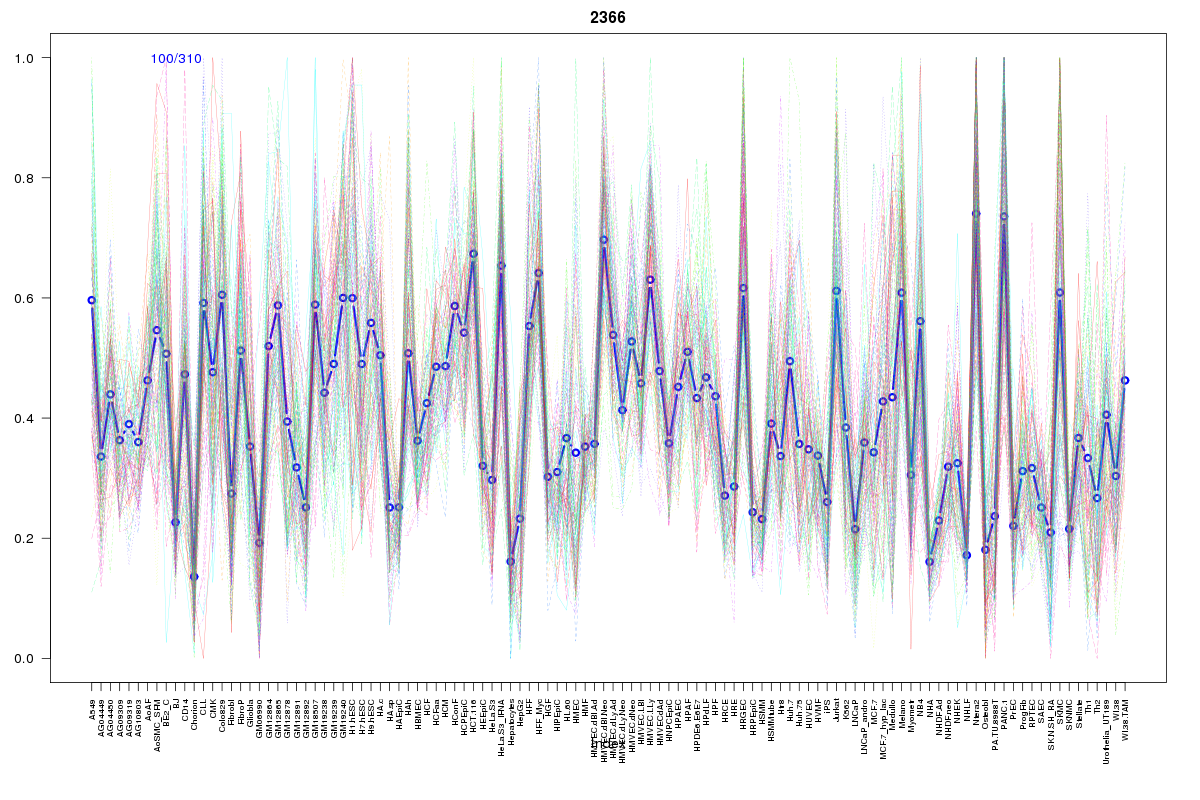
Cluster Hypersensitivity Profile

Genomic Location Trend
These plots show the distribution of the DHS sites surrounding the Transcript Start Site of the nearest gene.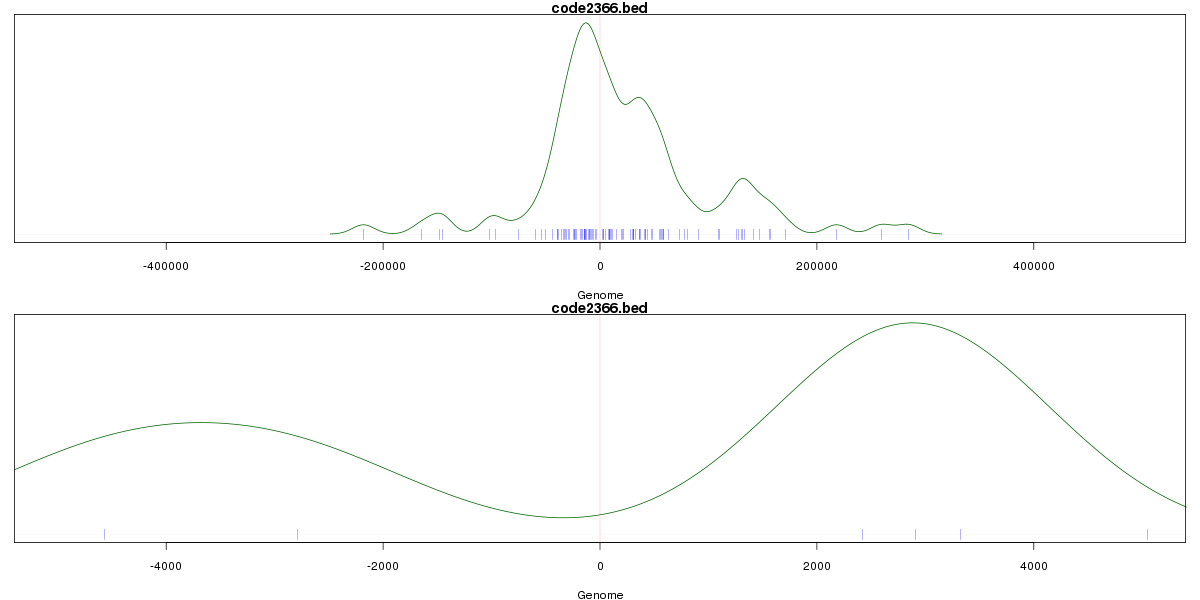
Stats
Number of sites: 310Promoter: 0%
CpG-Island: 0%
Conserved: 64%
Enriched Motifs & Matches
Match Detail: [Jaspar]
|
| ||
|---|---|---|
| Sites: 85/100 | e-val: 0 | ||
| Factor | e-val(match) | DB |
| CTCF | 0 | JASPAR |
| INSM1 | 0.000098658 | JASPAR |
| MYC::MAX | 0.001947 | JASPAR |
| TAL1::TCF3 | 0.0023245 | JASPAR |
| Zfp423 | 0.0092908 | JASPAR |
|
| ||
| Sites: 14/100 | e-val: 1.7 | ||
| Factor | e-val(match) | DB |
| Foxd3 | 0.0011108 | JASPAR |
| Foxq1 | 0.0015105 | JASPAR |
| FOXF2 | 0.0098719 | JASPAR |
| MEF2A | 0.013109 | JASPAR |
| EWSR1-FLI1 | 0.016283 | JASPAR |
BED file downloads
Top 10 Example Regions
| Location | Gene Link | Dist. |
|---|---|---|
| chr1: 149684160-149684310 | FCGR1A | 13.02 |
| chr1: 146861760-146861910 | OR13Z1P | 14.8 |
| chr1: 159184080-159184230 | MPTX1 | 58.79 |
| chr12: 9043280-9043430 | KLRG1 | 62.92 |
| chr12: 9192100-9192250 | RP11-436I9.6 | 62.99 |
| chr4: 88770260-88770410 | IBSP | 63.02 |
| chr3: 192162360-192162510 | FGF12 | 63.98 |
| chr3: 192162360-192162510 | snoU13 | 63.98 |
| chr10: 97006460-97006610 | PDLIM1 | 64.94 |
| chr10: 97006460-97006610 | RP11-310E22.4 | 64.94 |