SOM cluster: 2374
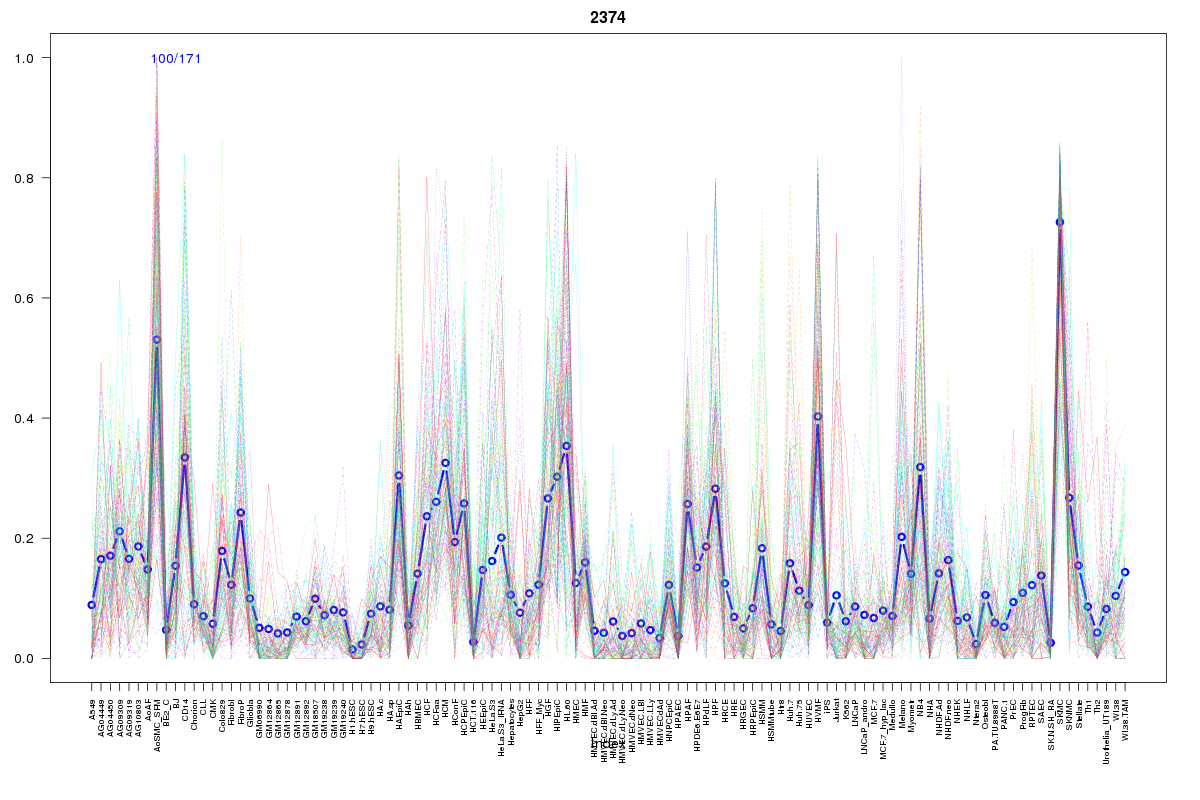
Cluster Hypersensitivity Profile

Genomic Location Trend
These plots show the distribution of the DHS sites surrounding the Transcript Start Site of the nearest gene.
Stats
Number of sites: 171Promoter: 2%
CpG-Island: 0%
Conserved: 36%
Enriched Motifs & Matches
Match Detail: [Jaspar]
|
| ||
|---|---|---|
| Sites: 55/100 | e-val: 1.7e-20 | ||
| Factor | e-val(match) | DB |
| CEBPA | 0.000000047772 | JASPAR |
| NFIL3 | 0.00002794 | JASPAR |
| HLF | 0.000095728 | JASPAR |
| Pou5f1 | 0.002276 | JASPAR |
| Sox2 | 0.0031461 | JASPAR |
BED file downloads
Top 10 Example Regions
| Location | Gene Link | Dist. |
|---|---|---|
| chr8: 29954540-29954690 | LEPROTL1 | 57.24 |
| chr3: 150455840-150455990 | RP11-103G8.1 | 60.72 |
| chr6: 16106260-16106410 | MYLIP | 61.4 |
| chr11: 114104640-114104790 | ZBTB16 | 65.48 |
| chr9: 90020760-90020910 | DAPK1 | 72.88 |
| chr5: 17284980-17285130 | RNU6-1003P | 73.85 |
| chr5: 17284980-17285130 | BASP1 | 73.85 |
| chr5: 17284980-17285130 | AC091878.1 | 73.85 |
| chr4: 70616960-70617110 | SULT1E1 | 78.66 |
| chr4: 88134640-88134790 | AFF1 | 84.41 |