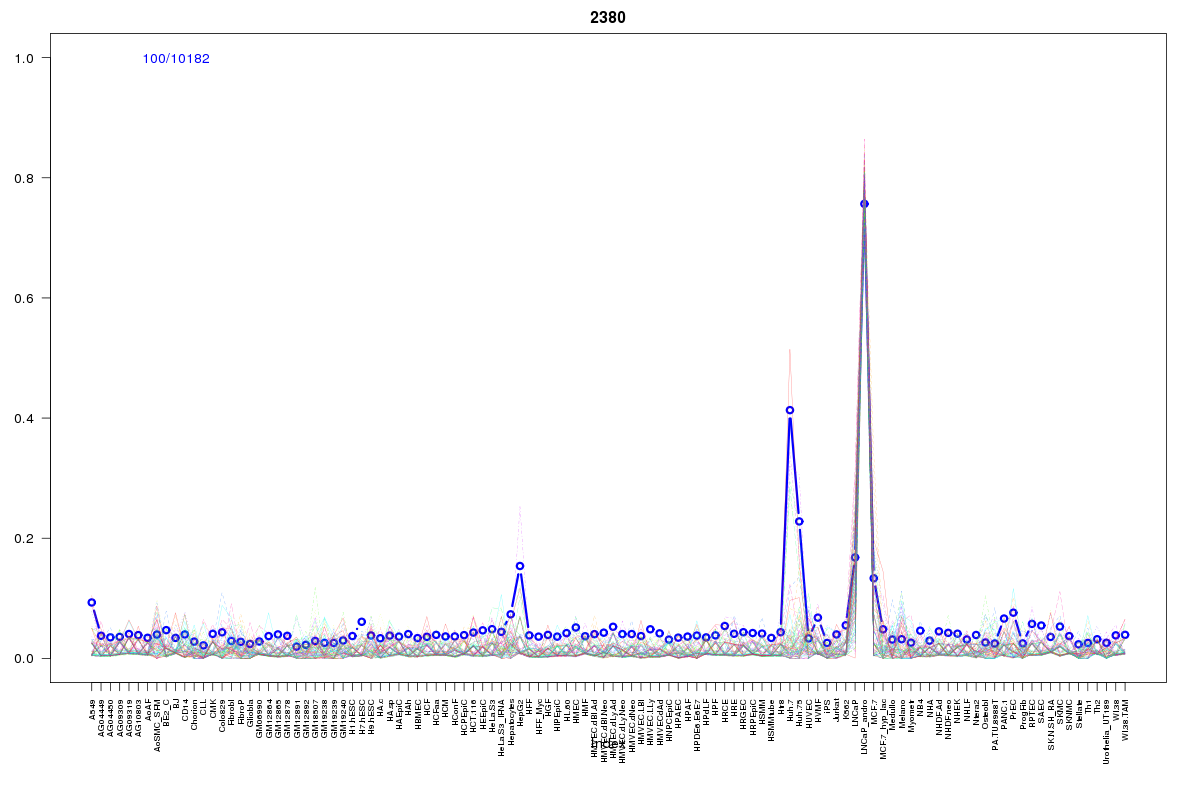
SOM cluster: 2380
Cluster Hypersensitivity Profile

Genomic Location Trend
These plots show the distribution of the DHS sites surrounding the Transcript Start Site of the nearest gene.
Stats
Number of sites: 10182Promoter: 0%
CpG-Island: 0%
Conserved: 8%
Enriched Motifs & Matches
Match Detail: [Jaspar]
|
| ||
|---|---|---|
| Sites: 14/100 | e-val: 0.92 | ||
| Factor | e-val(match) | DB |
| HNF1B | 0.000000032131 | JASPAR |
| NKX3-1 | 0.000008004 | JASPAR |
| HNF1A | 0.000012928 | JASPAR |
| MEF2A | 0.000091175 | JASPAR |
| Lhx3 | 0.00010451 | JASPAR |
BED file downloads
Top 10 Example Regions
| Location | Gene Link | Dist. |
|---|---|---|
| chr1: 151350080-151350230 | SELENBP1 | 19.63 |
| chr7: 107426540-107426690 | CBLL1 | 32.98 |
| chr7: 107426540-107426690 | AC002467.7 | 32.98 |
| chr7: 107426540-107426690 | SLC26A3 | 32.98 |
| chr11: 57272560-57272710 | SLC43A1 | 37.81 |
| chrX: 11091660-11091810 | ARHGAP6 | 39.45 |
| chr7: 107167740-107167890 | CTB-20D2.1 | 41.19 |
| chr11: 94880200-94880350 | ENDOD1 | 42.23 |
| chr11: 94880200-94880350 | SRSF8 | 42.23 |
| chr8: 17931100-17931250 | NAT1 | 42.44 |