SOM cluster: 2381
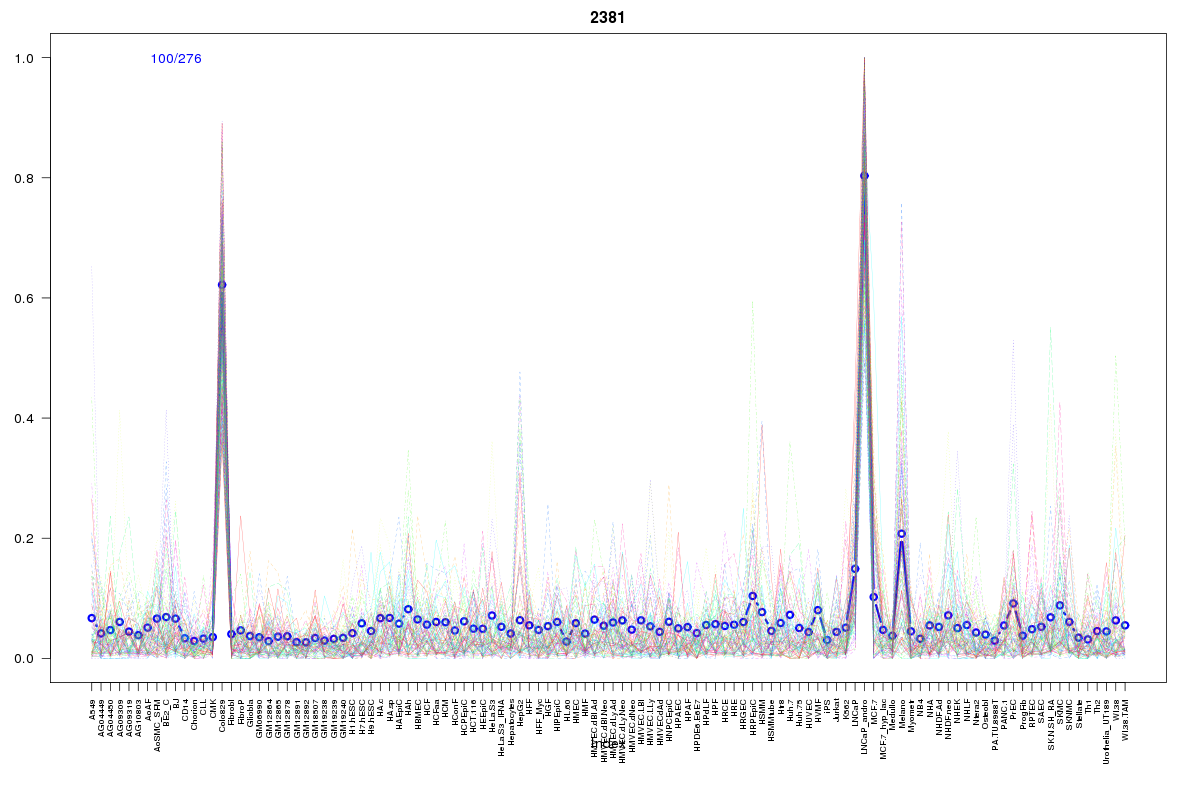
Cluster Hypersensitivity Profile

Genomic Location Trend
These plots show the distribution of the DHS sites surrounding the Transcript Start Site of the nearest gene.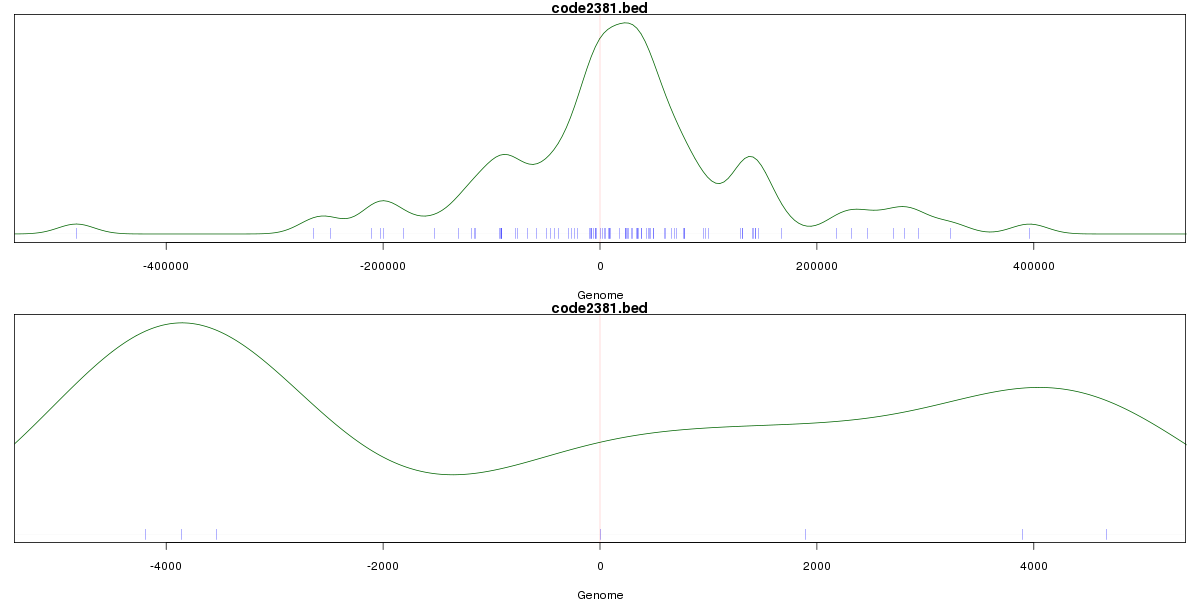
Stats
Number of sites: 276Promoter: 1%
CpG-Island: 0%
Conserved: 47%
Enriched Motifs & Matches
Match Detail: [Jaspar]
|
| ||
|---|---|---|
| Sites: 30/100 | e-val: 0.00000042 | ||
| Factor | e-val(match) | DB |
| Evi1 | 0.0058043 | JASPAR |
| Foxa2 | 0.0065002 | JASPAR |
| Foxq1 | 0.0067957 | JASPAR |
| FEV | 0.01161 | JASPAR |
| MEF2A | 0.01292 | JASPAR |
|
| ||
| Sites: 21/100 | e-val: 0.071 | ||
| Factor | e-val(match) | DB |
| AP1 | 0.0018654 | JASPAR |
| HOXA5 | 0.013508 | JASPAR |
| Lhx3 | 0.013893 | JASPAR |
| NFE2L2 | 0.019044 | JASPAR |
| SRY | 0.020802 | JASPAR |
BED file downloads
Top 10 Example Regions
| Location | Gene Link | Dist. |
|---|---|---|
| chr4: 88331440-88331590 | NUDT9 | 39.82 |
| chr4: 95681020-95681170 | RP11-168E14.1 | 43.57 |
| chr8: 3040620-3040770 | CSMD1 | 48.93 |
| chrX: 129728640-129728790 | ENOX2 | 59.46 |
| chr9: 104078060-104078210 | ZNF189 | 67.36 |
| chr9: 104078060-104078210 | MRPL50 | 67.36 |
| chr7: 133330700-133330850 | COX5BP3 | 69.11 |
| chr7: 133330700-133330850 | EXOC4 | 69.11 |
| chr12: 102009920-102010070 | CHPT1 | 71.76 |
| chr1: 212306780-212306930 | RP11-15I11.3 | 72.31 |