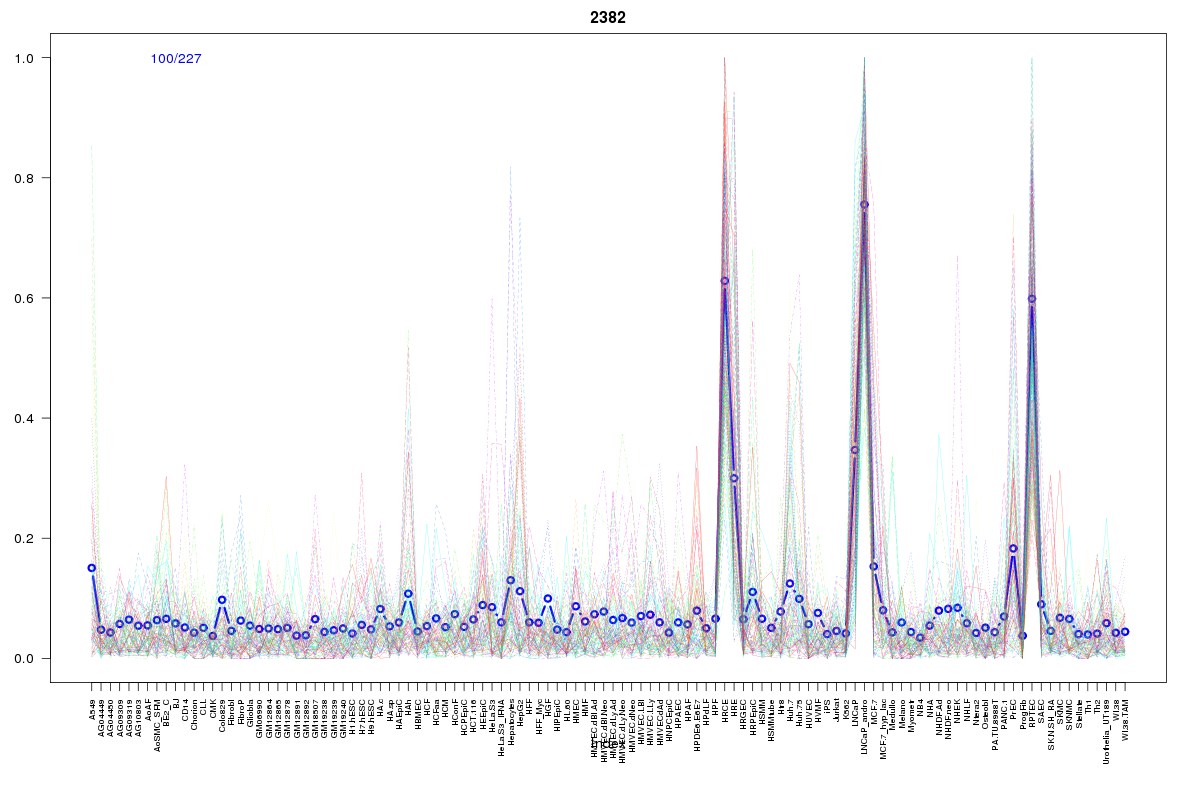
SOM cluster: 2382
Cluster Hypersensitivity Profile

Genomic Location Trend
These plots show the distribution of the DHS sites surrounding the Transcript Start Site of the nearest gene.
Stats
Number of sites: 227Promoter: 3%
CpG-Island: 0%
Conserved: 45%
Enriched Motifs & Matches
Match Detail: [Jaspar]
|
| ||
|---|---|---|
| Sites: 25/100 | e-val: 0.02 | ||
| Factor | e-val(match) | DB |
| HNF1A | 0.0000000053105 | JASPAR |
| HNF1B | 0.00000078642 | JASPAR |
| FOXA1 | 0.0000044459 | JASPAR |
| Foxa2 | 0.0000065208 | JASPAR |
| FOXI1 | 0.00003777 | JASPAR |
BED file downloads
Top 10 Example Regions
| Location | Gene Link | Dist. |
|---|---|---|
| chr2: 120356280-120356430 | PCDP1 | 41.25 |
| chr13: 28025265-28025415 | LNX2 | 49.55 |
| chr11: 126084860-126085010 | FAM118B | 57.29 |
| chr16: 21174280-21174430 | CRYM | 61.41 |
| chr18: 11990180-11990330 | IMPA2 | 64.11 |
| chr3: 133112160-133112310 | RP11-91K8.4 | 66.43 |
| chr4: 6748605-6748755 | KIAA0232 | 70.33 |
| chr9: 37418240-37418390 | GRHPR | 73.23 |
| chr1: 17891280-17891430 | ARHGEF10L | 74.29 |
| chr4: 41365840-41365990 | LIMCH1 | 81 |