SOM cluster: 239
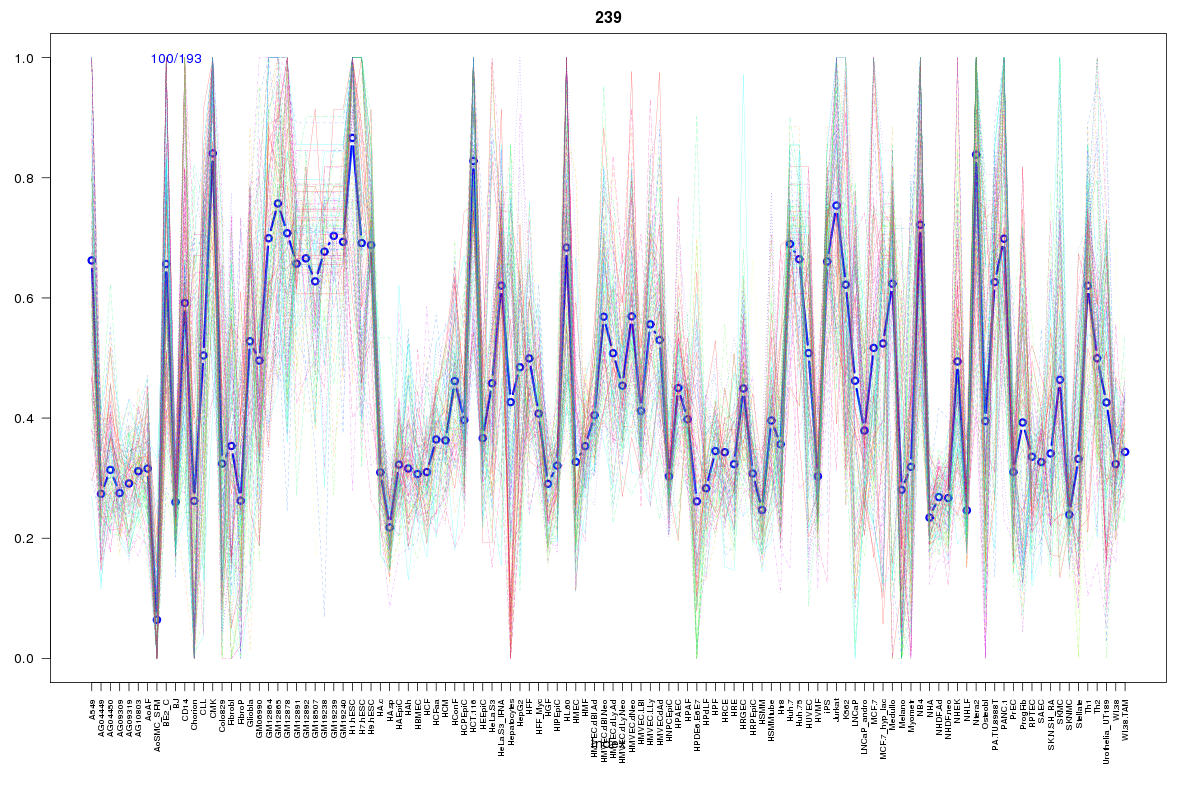
Cluster Hypersensitivity Profile

Genomic Location Trend
These plots show the distribution of the DHS sites surrounding the Transcript Start Site of the nearest gene.
Stats
Number of sites: 193Promoter: 2%
CpG-Island: 0%
Conserved: 51%
Enriched Motifs & Matches
Match Detail: [Jaspar]
|
| ||
|---|---|---|
| Sites: 74/100 | e-val: 0 | ||
| Factor | e-val(match) | DB |
| CTCF | 2.2204e-16 | JASPAR |
| INSM1 | 0.00000048148 | JASPAR |
| SP1 | 0.0016606 | JASPAR |
| MYC::MAX | 0.0051249 | JASPAR |
| Zfp423 | 0.0079636 | JASPAR |
|
| ||
| Sites: 33/100 | e-val: 0.000055 | ||
| Factor | e-val(match) | DB |
| SP1 | 0.0000052291 | JASPAR |
| Klf4 | 0.000076194 | JASPAR |
| Tal1::Gata1 | 0.00078121 | JASPAR |
| RREB1 | 0.00080335 | JASPAR |
| Myf | 0.0071976 | JASPAR |
BED file downloads
Top 10 Example Regions
| Location | Gene Link | Dist. |
|---|---|---|
| chr1: 203296980-203297130 | FMOD | 42.09 |
| chr19: 13323760-13323910 | IER2 | 49.83 |
| chr19: 13323760-13323910 | TRMT1 | 49.83 |
| chr12: 49437640-49437790 | RP11-386G11.3 | 58.45 |
| chr3: 51753300-51753450 | RAD54L2 | 59.53 |
| chr22: 37418105-37418255 | CSF2RB | 60.17 |
| chr1: 24243340-24243490 | CNR2 | 60.76 |
| chr1: 24243340-24243490 | RP11-4M23.2 | 60.76 |
| chr1: 24243340-24243490 | SRSF10 | 60.76 |
| chr19: 41108120-41108270 | SHKBP1 | 61.01 |