SOM cluster: 2399
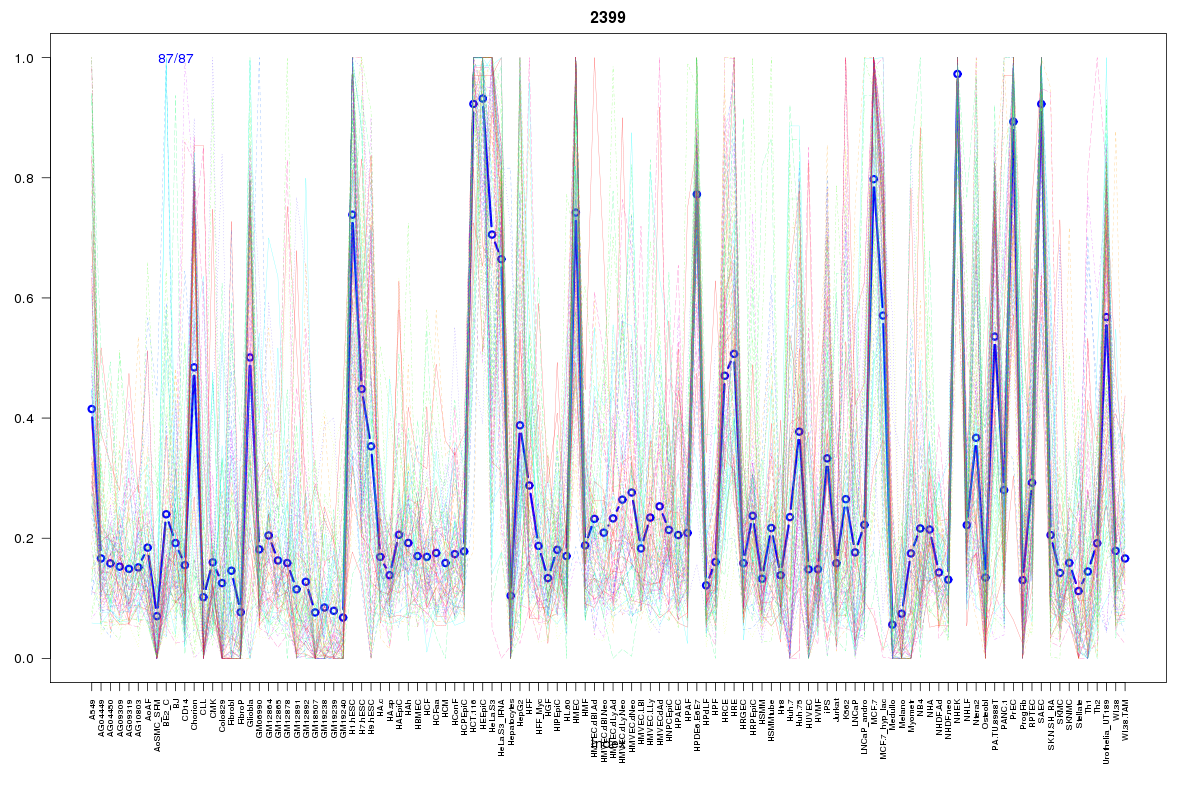
Cluster Hypersensitivity Profile

Genomic Location Trend
These plots show the distribution of the DHS sites surrounding the Transcript Start Site of the nearest gene.
Stats
Number of sites: 87Promoter: 13%
CpG-Island: 9%
Conserved: 50%
Enriched Motifs & Matches
Match Detail: [Jaspar]
|
| ||
|---|---|---|
| Sites: 77/87 | e-val: 3.39955e-42 | ||
| Factor | e-val(match) | DB |
| SP1 | 0.000000088643 | JASPAR |
| Tal1::Gata1 | 0.00000026696 | JASPAR |
| INSM1 | 0.000017208 | JASPAR |
| Klf4 | 0.00091836 | JASPAR |
| RREB1 | 0.003193 | JASPAR |
|
| ||
| Sites: 37/87 | e-val: 5.5e-20 | ||
| Factor | e-val(match) | DB |
| AP1 | 0.0000000052586 | JASPAR |
| NFE2L2 | 0.00000085609 | JASPAR |
| PPARG | 0.010514 | JASPAR |
| NFE2L1::MafG | 0.030735 | JASPAR |
| ZEB1 | 0.034719 | JASPAR |
|
| ||
| Sites: 31/87 | e-val: 0.0000033 | ||
| Factor | e-val(match) | DB |
| TFAP2A | 0.0002985 | JASPAR |
| REST | 0.00031327 | JASPAR |
| PLAG1 | 0.0004559 | JASPAR |
| Zfx | 0.0019362 | JASPAR |
| SP1 | 0.003818 | JASPAR |
|
| ||
| Sites: 23/87 | e-val: 0.014 | ||
| Factor | e-val(match) | DB |
| Klf4 | 0.000002169 | JASPAR |
| Pax4 | 0.000084651 | JASPAR |
| SP1 | 0.00024541 | JASPAR |
| RREB1 | 0.0015897 | JASPAR |
| ZNF354C | 0.011398 | JASPAR |
|
| ||
| Sites: 12/87 | e-val: 1.3 | ||
| Factor | e-val(match) | DB |
| TP53 | 0.00016712 | JASPAR |
| Stat3 | 0.00040675 | JASPAR |
| Myf | 0.0045698 | JASPAR |
| ZEB1 | 0.0069375 | JASPAR |
| INSM1 | 0.0080828 | JASPAR |
BED file downloads
Top 10 Example Regions
| Location | Gene Link | Dist. |
|---|---|---|
| chr8: 124194740-124194890 | FAM83A | 34.12 |
| chr11: 130016380-130016530 | APLP2 | 52.07 |
| chr21: 46432700-46432850 | ITGB2 | 55.56 |
| chr21: 46432700-46432850 | ITGB2-AS1 | 55.56 |
| chr9: 117670560-117670710 | TNFSF8 | 62.27 |
| chr11: 64610580-64610730 | CDC42BPG | 63.19 |
| chr21: 40285480-40285630 | AP001044.2 | 70.69 |
| chr21: 40285480-40285630 | ETS2 | 70.69 |
| chr3: 32023140-32023290 | ZNF860 | 71.01 |
| chr3: 32023140-32023290 | OSBPL10 | 71.01 |