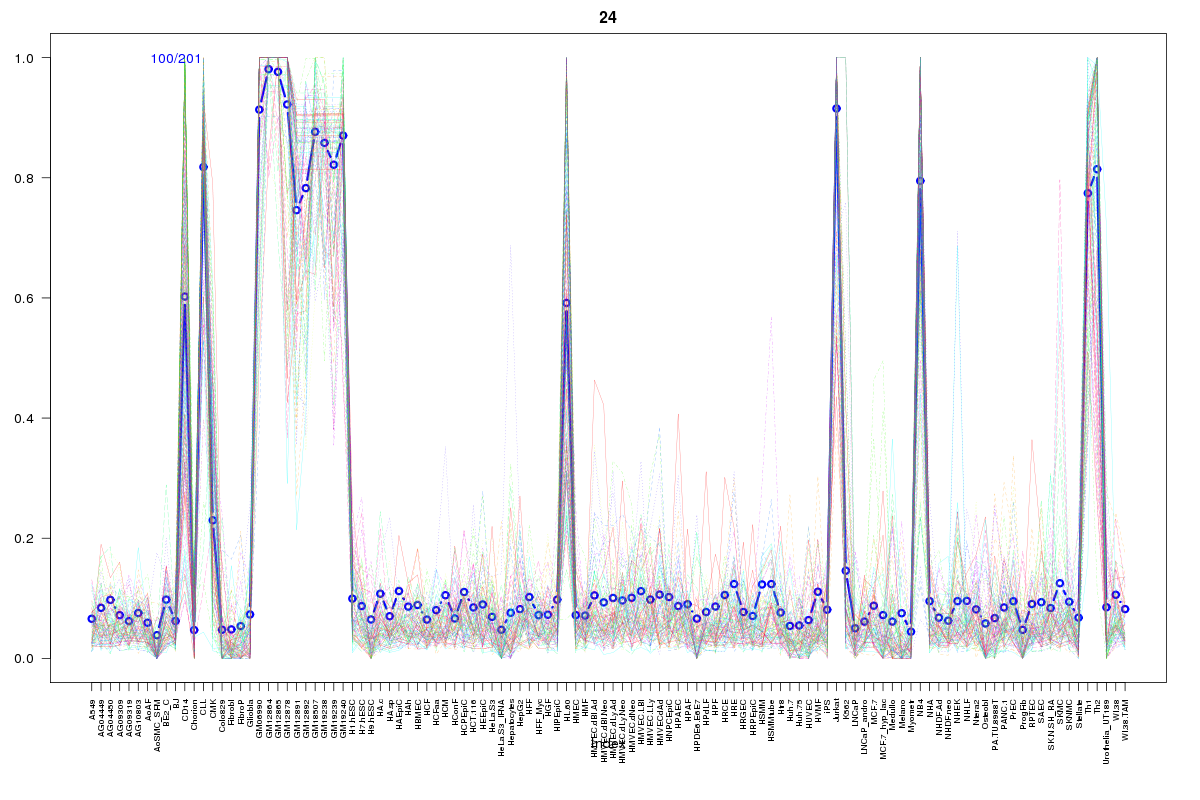
SOM cluster: 24
Cluster Hypersensitivity Profile

Genomic Location Trend
These plots show the distribution of the DHS sites surrounding the Transcript Start Site of the nearest gene.
Stats
Number of sites: 201Promoter: 18%
CpG-Island: 3%
Conserved: 48%
Enriched Motifs & Matches
Match Detail: [Jaspar]
|
| ||
|---|---|---|
| Sites: 45/100 | e-val: 6.1e-16 | ||
| Factor | e-val(match) | DB |
| SPI1 | 0.0000000053997 | JASPAR |
| FEV | 0.000000008653 | JASPAR |
| GABPA | 0.00000050577 | JASPAR |
| ELF5 | 0.0000021429 | JASPAR |
| ELK4 | 0.0000025346 | JASPAR |
|
| ||
| Sites: 45/100 | e-val: 0.000000000022 | ||
| Factor | e-val(match) | DB |
| RUNX1 | 0.00000000021571 | JASPAR |
| RREB1 | 0.00036652 | JASPAR |
| ZNF354C | 0.0027696 | JASPAR |
| Tcfcp2l1 | 0.0064129 | JASPAR |
| IRF2 | 0.012997 | JASPAR |
|
| ||
| Sites: 30/100 | e-val: 0.000004 | ||
| Factor | e-val(match) | DB |
| RREB1 | 0.0000000037711 | JASPAR |
| SP1 | 0.00000032163 | JASPAR |
| Klf4 | 0.0000013364 | JASPAR |
| Pax4 | 0.0000086867 | JASPAR |
| Egr1 | 0.0015951 | JASPAR |
BED file downloads
Top 10 Example Regions
| Location | Gene Link | Dist. |
|---|---|---|
| chr1: 160765820-160765970 | CD48 | 36.35 |
| chr1: 160765820-160765970 | CD244 | 36.35 |
| chr1: 160765820-160765970 | LY9 | 36.35 |
| chr1: 160765820-160765970 | SLAMF7 | 36.35 |
| chr1: 26616320-26616470 | CEP85 | 38.72 |
| chr1: 26616320-26616470 | CD52 | 38.72 |
| chr9: 134132040-134132190 | FAM78A | 43.85 |
| chr9: 134132040-134132190 | PPAPDC3 | 43.85 |
| chr12: 4252180-4252330 | RP11-320N7.1 | 44.56 |
| chr2: 68954240-68954390 | ARHGAP25 | 45.94 |