SOM cluster: 2433
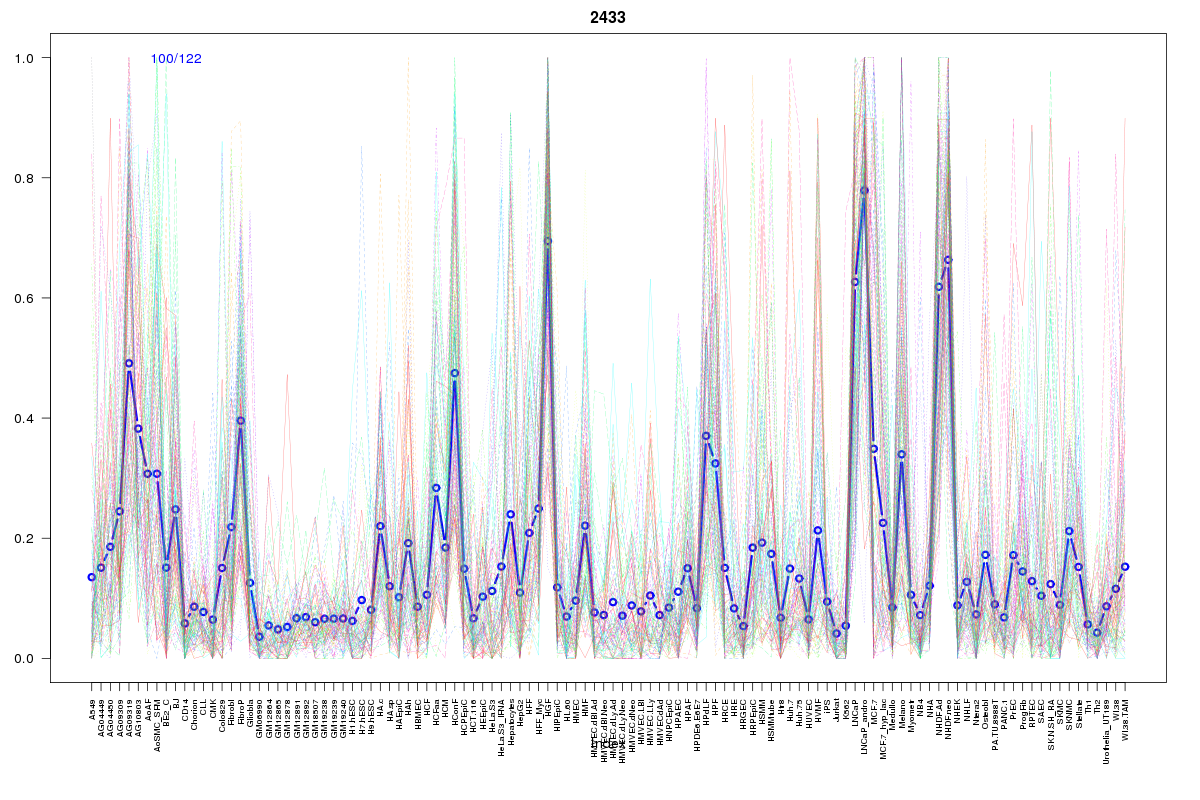
Cluster Hypersensitivity Profile

Genomic Location Trend
These plots show the distribution of the DHS sites surrounding the Transcript Start Site of the nearest gene.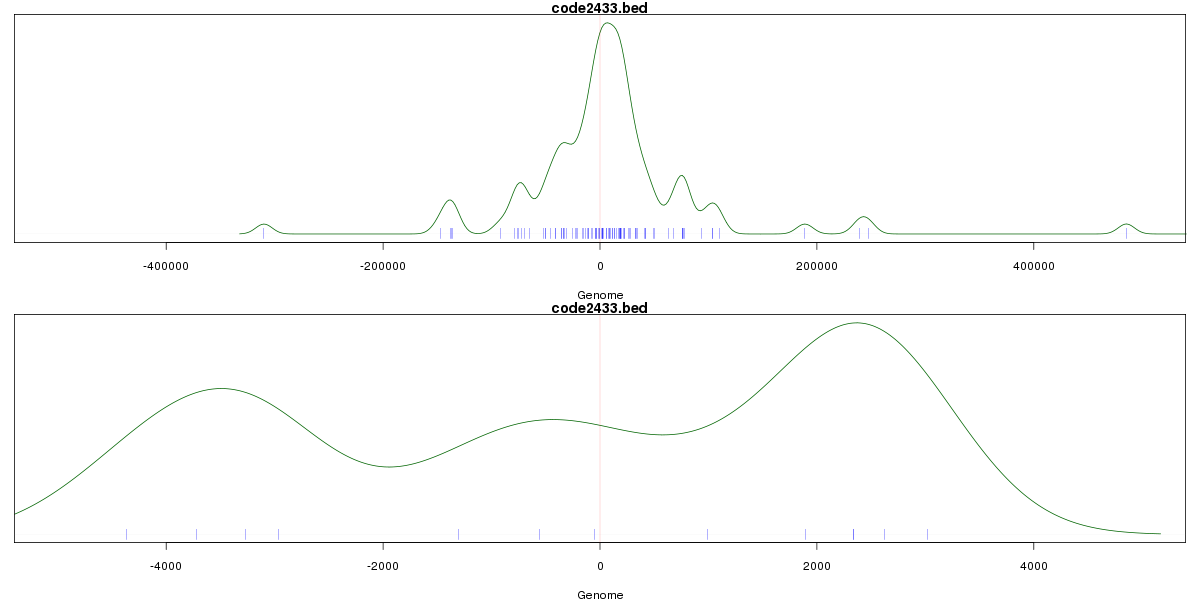
Stats
Number of sites: 122Promoter: 3%
CpG-Island: 1%
Conserved: 59%
Enriched Motifs & Matches
Match Detail: [Jaspar]
|
| ||
|---|---|---|
| Sites: 26/100 | e-val: 0.00000005 | ||
| Factor | e-val(match) | DB |
| FOXA1 | 0.000000063559 | JASPAR |
| Foxa2 | 0.00000028602 | JASPAR |
| Foxd3 | 0.00000030394 | JASPAR |
| FOXD1 | 0.00000072762 | JASPAR |
| FOXO3 | 0.0000023475 | JASPAR |
BED file downloads
Top 10 Example Regions
| Location | Gene Link | Dist. |
|---|---|---|
| chr1: 151344020-151344170 | RP11-126K1.6 | 20.13 |
| chr1: 151344020-151344170 | RFX5 | 20.13 |
| chr1: 151344020-151344170 | SELENBP1 | 20.13 |
| chr1: 151344020-151344170 | POGZ | 20.13 |
| chr2: 119998065-119998215 | STEAP3 | 31.96 |
| chr2: 119998065-119998215 | C1QL2 | 31.96 |
| chr6: 119562340-119562490 | MAN1A1 | 35.94 |
| chr6: 119562340-119562490 | RP3-354N19.1 | 35.94 |
| chr8: 103980920-103981070 | KB-1507C5.2 | 56.5 |
| chr1: 180143160-180143310 | LHX4 | 56.85 |