SOM cluster: 2435
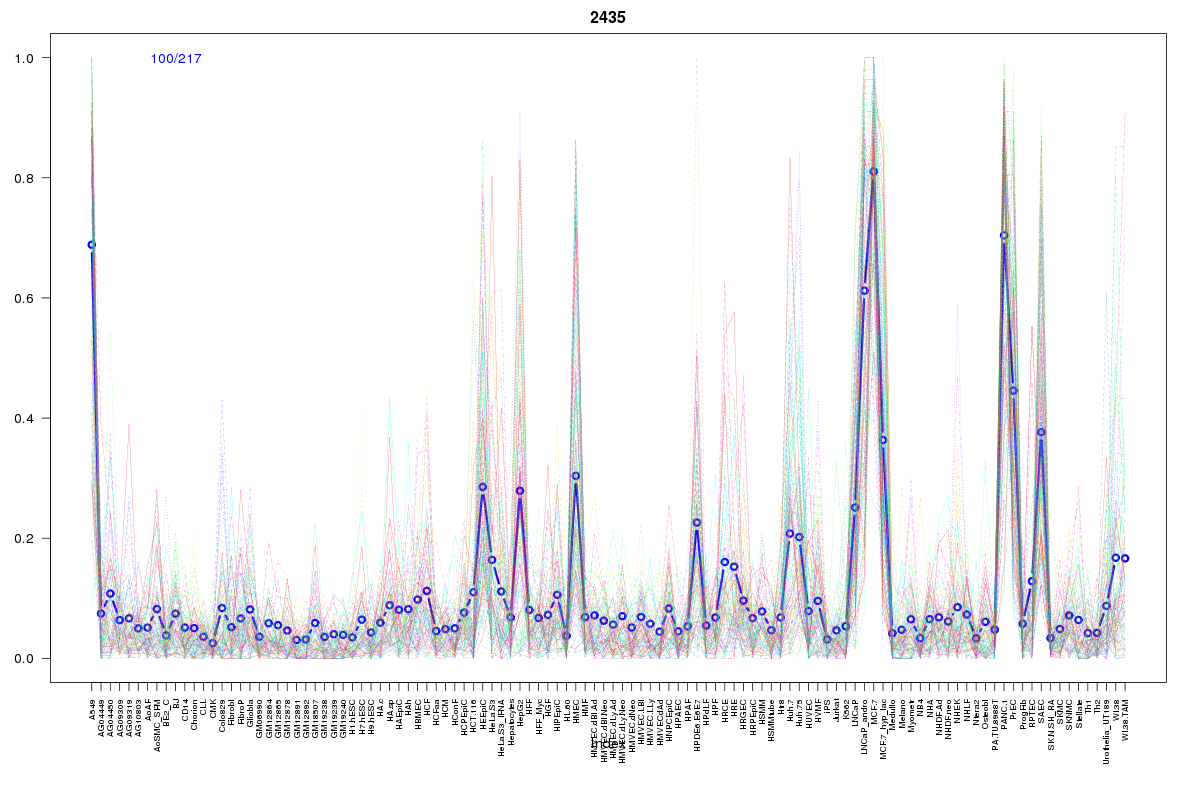
Cluster Hypersensitivity Profile

Genomic Location Trend
These plots show the distribution of the DHS sites surrounding the Transcript Start Site of the nearest gene.
Stats
Number of sites: 217Promoter: 1%
CpG-Island: 0%
Conserved: 34%
Enriched Motifs & Matches
Match Detail: [Jaspar]
|
| ||
|---|---|---|
| Sites: 62/100 | e-val: 6.7e-19 | ||
| Factor | e-val(match) | DB |
| Foxa2 | 0.0000000000083744 | JASPAR |
| FOXA1 | 0.0000000000097643 | JASPAR |
| FOXD1 | 0.0000073977 | JASPAR |
| FOXO3 | 0.000011935 | JASPAR |
| FOXI1 | 0.000051886 | JASPAR |
BED file downloads
Top 10 Example Regions
| Location | Gene Link | Dist. |
|---|---|---|
| chr8: 102619960-102620110 | GRHL2 | 34.08 |
| chr8: 102619960-102620110 | NCALD | 34.08 |
| chr3: 32146840-32146990 | GPD1L | 48.87 |
| chr7: 73245385-73245535 | ABHD11 | 55.92 |
| chr7: 73245385-73245535 | WBSCR27 | 55.92 |
| chr7: 73245385-73245535 | CLDN3 | 55.92 |
| chr7: 73245385-73245535 | CLDN4 | 55.92 |
| chr8: 87302340-87302490 | WWP1 | 60.48 |
| chr8: 87302340-87302490 | CTD-2284J15.1 | 60.48 |
| chr1: 161367940-161368090 | MPZ | 60.89 |