SOM cluster: 2441
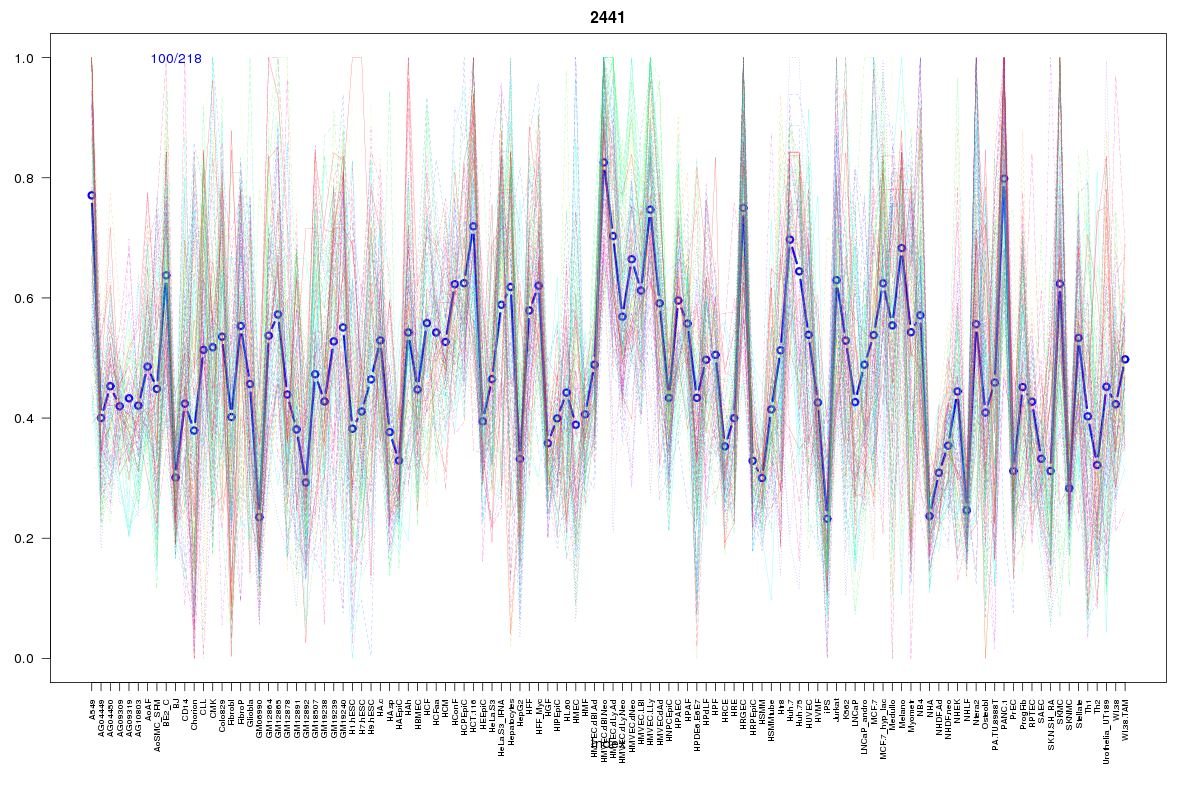
Cluster Hypersensitivity Profile

Genomic Location Trend
These plots show the distribution of the DHS sites surrounding the Transcript Start Site of the nearest gene.
Stats
Number of sites: 218Promoter: 4%
CpG-Island: 0%
Conserved: 71%
Enriched Motifs & Matches
Match Detail: [Jaspar]
|
| ||
|---|---|---|
| Sites: 81/100 | e-val: 0 | ||
| Factor | e-val(match) | DB |
| CTCF | 0 | JASPAR |
| INSM1 | 0.000040464 | JASPAR |
| Zfp423 | 0.0024473 | JASPAR |
| SP1 | 0.0052356 | JASPAR |
| T | 0.017569 | JASPAR |
BED file downloads
Top 10 Example Regions
| Location | Gene Link | Dist. |
|---|---|---|
| chr3: 32440640-32440790 | CMTM7 | 33.44 |
| chr6: 30137920-30138070 | TRIM40 | 43.06 |
| chr7: 112190640-112190790 | AC002463.3 | 49.92 |
| chr12: 110291000-110291150 | GIT2 | 59.43 |
| chr11: 124539140-124539290 | ESAM | 61.77 |
| chr6: 160284380-160284530 | PNLDC1 | 63.68 |
| chr6: 160284380-160284530 | SNORA20 | 63.68 |
| chr6: 114178120-114178270 | MARCKS | 72.85 |
| chr6: 114178120-114178270 | RP11-544L8__B.4 | 72.85 |
| chr17: 66432240-66432390 | PRKAR1A | 72.87 |