SOM cluster: 2465
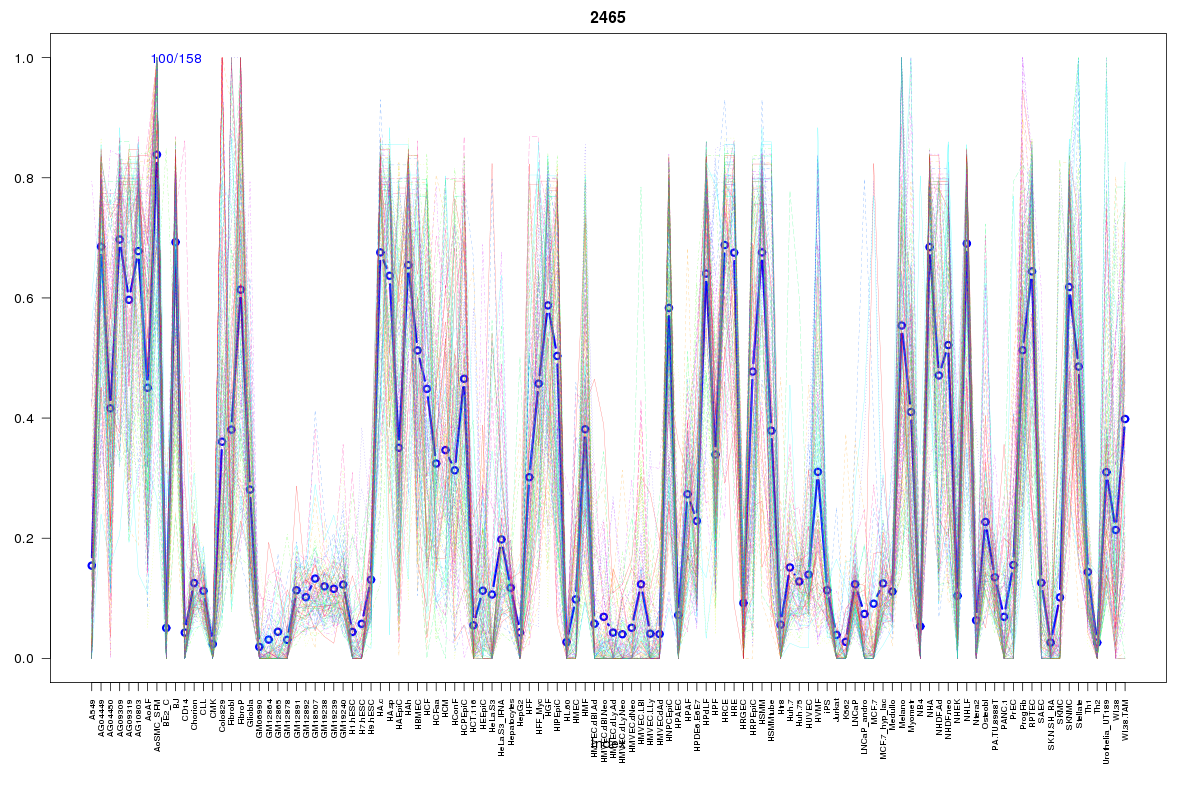
Cluster Hypersensitivity Profile

Genomic Location Trend
These plots show the distribution of the DHS sites surrounding the Transcript Start Site of the nearest gene.
Stats
Number of sites: 158Promoter: 1%
CpG-Island: 0%
Conserved: 55%
Enriched Motifs & Matches
Match Detail: [Jaspar]
|
| ||
|---|---|---|
| Sites: 38/100 | e-val: 6.2e-16 | ||
| Factor | e-val(match) | DB |
| NFATC2 | 0.000039138 | JASPAR |
| Foxd3 | 0.000064264 | JASPAR |
| Foxq1 | 0.0054415 | JASPAR |
| MEF2A | 0.0099896 | JASPAR |
| Lhx3 | 0.011253 | JASPAR |
|
| ||
| Sites: 25/100 | e-val: 0.0094 | ||
| Factor | e-val(match) | DB |
| TEAD1 | 0.0000094243 | JASPAR |
| Stat3 | 0.00017929 | JASPAR |
| NF-kappaB | 0.0015676 | JASPAR |
| Hand1::Tcfe2a | 0.0015736 | JASPAR |
| NFATC2 | 0.0019736 | JASPAR |
BED file downloads
Top 10 Example Regions
| Location | Gene Link | Dist. |
|---|---|---|
| chr5: 124748720-124748870 | RN7SKP117 | 54.65 |
| chr11: 20053080-20053230 | NAV2-AS2 | 56.5 |
| chr11: 20053080-20053230 | NAV2 | 56.5 |
| chr2: 40330380-40330530 | SLC8A1 | 57.41 |
| chr3: 149219480-149219630 | RP11-278L15.3 | 61.3 |
| chr3: 149219480-149219630 | WWTR1 | 61.3 |
| chr17: 44150480-44150630 | KANSL1 | 62.45 |
| chr4: 183477320-183477470 | TENM3 | 62.57 |
| chr4: 87586260-87586410 | PTPN13 | 65.95 |
| chr5: 38595560-38595710 | LIFR | 68.16 |