SOM cluster: 2485
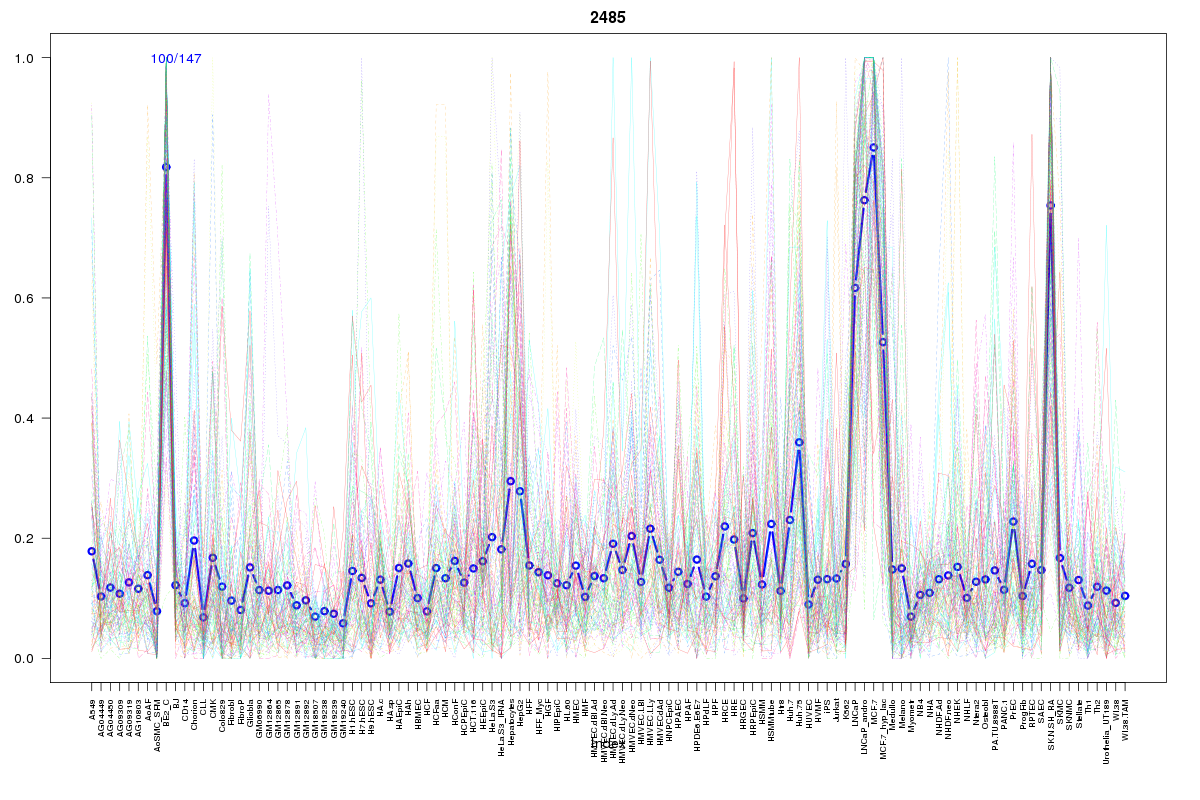
Cluster Hypersensitivity Profile

Genomic Location Trend
These plots show the distribution of the DHS sites surrounding the Transcript Start Site of the nearest gene.
Stats
Number of sites: 147Promoter: 11%
CpG-Island: 5%
Conserved: 50%
Enriched Motifs & Matches
Match Detail: [Jaspar]
|
| ||
|---|---|---|
| Sites: 58/100 | e-val: 4.4e-29 | ||
| Factor | e-val(match) | DB |
| TLX1::NFIC | 0.0000000050021 | JASPAR |
| INSM1 | 0.0006213 | JASPAR |
| Hand1::Tcfe2a | 0.020434 | JASPAR |
| NFIC | 0.027875 | JASPAR |
| ESR2 | 0.028143 | JASPAR |
|
| ||
| Sites: 38/100 | e-val: 0.000000066 | ||
| Factor | e-val(match) | DB |
| ESR1 | 0.013258 | JASPAR |
| FEV | 0.017222 | JASPAR |
| TP53 | 0.020733 | JASPAR |
| Stat3 | 0.026648 | JASPAR |
| INSM1 | 0.027142 | JASPAR |
BED file downloads
Top 10 Example Regions
| Location | Gene Link | Dist. |
|---|---|---|
| chr1: 154547205-154547355 | TDRD10 | 49.31 |
| chr1: 154547205-154547355 | SHE | 49.31 |
| chr11: 67350220-67350370 | NDUFV1 | 55.83 |
| chr9: 85676960-85677110 | RASEF | 56.24 |
| chr17: 40125040-40125190 | TTC25 | 56.31 |
| chr17: 61509980-61510130 | CYB561 | 64.3 |
| chr17: 61509980-61510130 | AC015923.1 | 64.3 |
| chr1: 204099460-204099610 | GOLT1A | 64.69 |
| chr1: 204099460-204099610 | ETNK2 | 64.69 |
| chr1: 204099460-204099610 | PLEKHA6 | 64.69 |