SOM cluster: 251
Cluster Hypersensitivity Profile

Genomic Location Trend
These plots show the distribution of the DHS sites surrounding the Transcript Start Site of the nearest gene.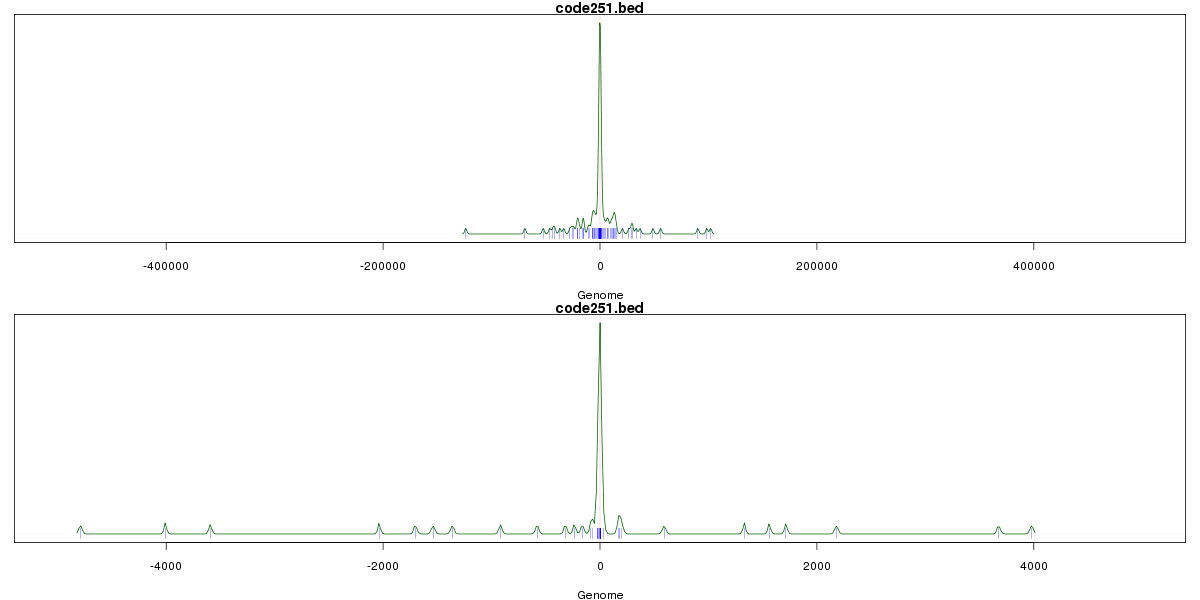
Stats
Number of sites: 1651Promoter: 39%
CpG-Island: 45%
Conserved: 77%
Enriched Motifs & Matches
Match Detail: [Jaspar]
|
| ||
|---|---|---|
| Sites: 92/100 | e-val: 0 | ||
| Factor | e-val(match) | DB |
| CTCF | 0.0000000000000082157 | JASPAR |
| INSM1 | 0.0000033629 | JASPAR |
| SP1 | 0.00043698 | JASPAR |
| MYC::MAX | 0.0048071 | JASPAR |
| TFAP2A | 0.028238 | JASPAR |
|
| ||
| Sites: 68/100 | e-val: 5.9e-40 | ||
| Factor | e-val(match) | DB |
| SP1 | 0.0000013268 | JASPAR |
| TFAP2A | 0.000058623 | JASPAR |
| PLAG1 | 0.0019034 | JASPAR |
| RREB1 | 0.0019743 | JASPAR |
| Egr1 | 0.003443 | JASPAR |
|
| ||
| Sites: 37/100 | e-val: 0.000000029 | ||
| Factor | e-val(match) | DB |
| SP1 | 0.0000060589 | JASPAR |
| TFAP2A | 0.0006556 | JASPAR |
| PLAG1 | 0.002155 | JASPAR |
| Klf4 | 0.0021695 | JASPAR |
| Egr1 | 0.0038556 | JASPAR |
BED file downloads
Top 10 Example Regions
| Location | Gene Link | Dist. |
|---|---|---|
| chr3: 128336880-128337030 | C3orf27 | 39.92 |
| chr19: 10602880-10603030 | CDC37 | 41.08 |
| chr1: 149379605-149379755 | RP11-403I13.8 | 42.24 |
| chr10: 11784380-11784530 | PROSER2 | 44.97 |
| chr11: 64555165-64555315 | MAP4K2 | 45.53 |
| chr4: 1630920-1631070 | TMEM129 | 47.07 |
| chr19: 49946540-49946690 | PIH1D1 | 47.87 |
| chr19: 49946540-49946690 | DKKL1 | 47.87 |
| chr19: 49946540-49946690 | RCN3 | 47.87 |
| chr19: 49946540-49946690 | FCGRT | 47.87 |