SOM cluster: 260
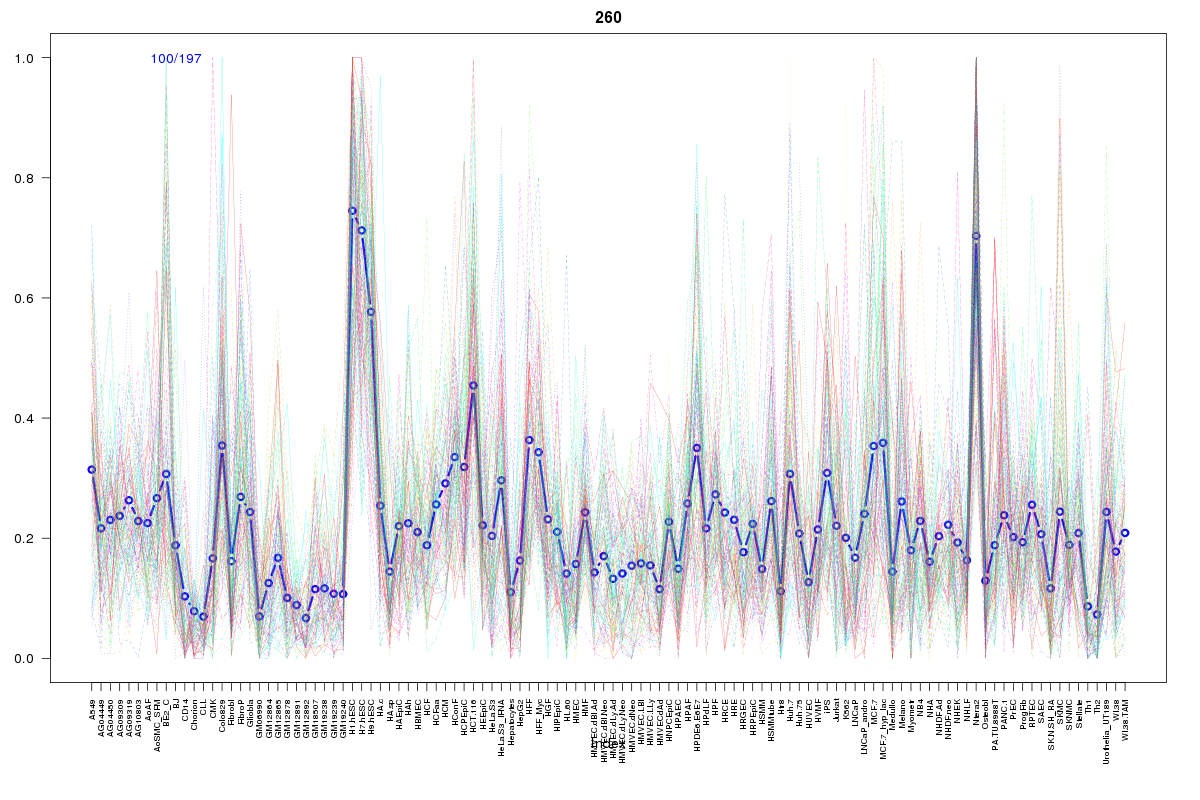
Cluster Hypersensitivity Profile

Genomic Location Trend
These plots show the distribution of the DHS sites surrounding the Transcript Start Site of the nearest gene.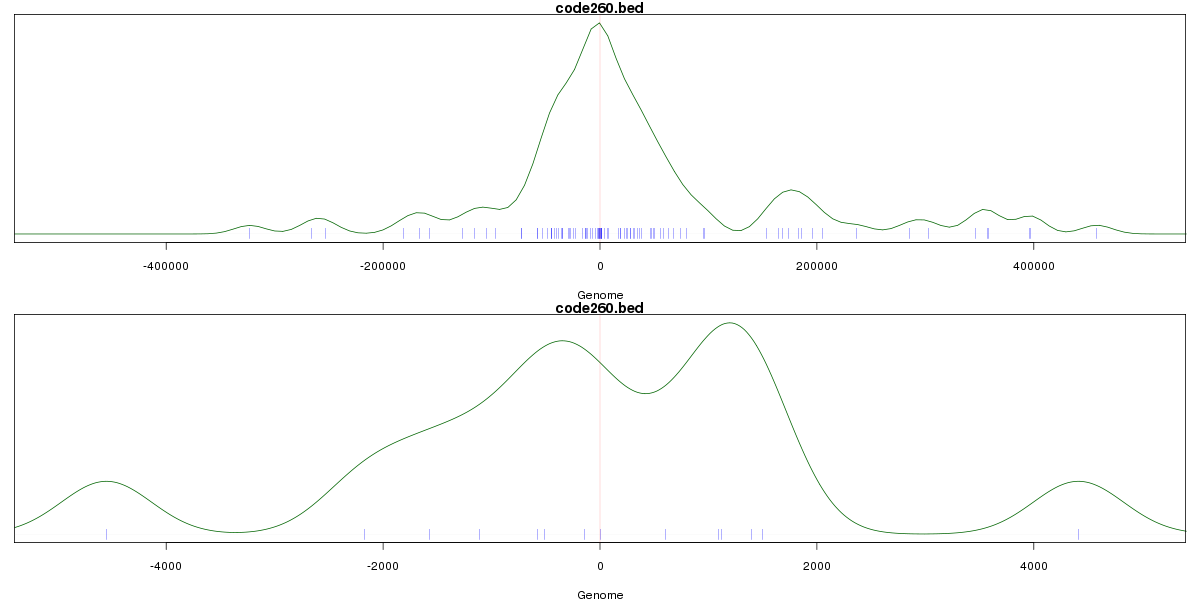
Stats
Number of sites: 197Promoter: 7%
CpG-Island: 1%
Conserved: 49%
Enriched Motifs & Matches
Match Detail: [Jaspar]
|
| ||
|---|---|---|
| Sites: 56/100 | e-val: 3.4e-40 | ||
| Factor | e-val(match) | DB |
| CTCF | 0 | JASPAR |
| INSM1 | 0.00000073884 | JASPAR |
| SP1 | 0.00011532 | JASPAR |
| MYC::MAX | 0.0043795 | JASPAR |
| PPARG::RXRA | 0.013928 | JASPAR |
BED file downloads
Top 10 Example Regions
| Location | Gene Link | Dist. |
|---|---|---|
| chr1: 151137620-151137770 | TMOD4 | 27.3 |
| chr9: 110184480-110184630 | KLF4 | 36.11 |
| chr9: 110184480-110184630 | RAD23B | 36.11 |
| chr13: 23733485-23733635 | LINC00362 | 44.4 |
| chr9: 115517060-115517210 | SNX30 | 48.08 |
| chr4: 40631520-40631670 | RBM47 | 51.75 |
| chr3: 159304440-159304590 | IQCJ-SCHIP1 | 54.16 |
| chr6: 52984980-52985130 | RN7SL244P | 56.05 |
| chr6: 52984980-52985130 | GCM1 | 56.05 |
| chr2: 166555180-166555330 | CSRNP3 | 60.86 |