SOM cluster: 275
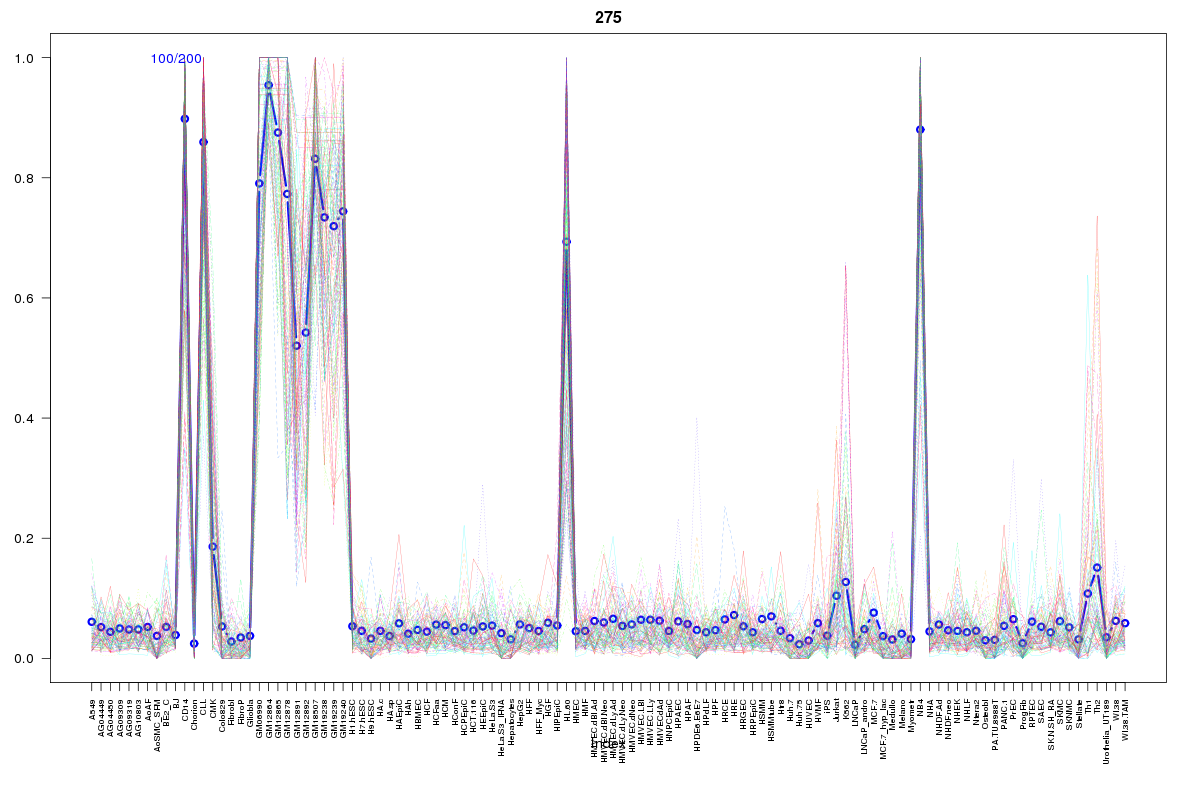
Cluster Hypersensitivity Profile

Genomic Location Trend
These plots show the distribution of the DHS sites surrounding the Transcript Start Site of the nearest gene.
Stats
Number of sites: 200Promoter: 9%
CpG-Island: 0%
Conserved: 42%
Enriched Motifs & Matches
Match Detail: [Jaspar]
|
| ||
|---|---|---|
| Sites: 68/100 | e-val: 0 | ||
| Factor | e-val(match) | DB |
| SPI1 | 0.000000047908 | JASPAR |
| SPIB | 0.00000055097 | JASPAR |
| IRF1 | 0.0000090395 | JASPAR |
| FEV | 0.0001976 | JASPAR |
| GABPA | 0.00069809 | JASPAR |
|
| ||
| Sites: 11/100 | e-val: 0.0037 | ||
| Factor | e-val(match) | DB |
| TAL1::TCF3 | 0.00057738 | JASPAR |
| ELK4 | 0.00072397 | JASPAR |
| IRF1 | 0.0018742 | JASPAR |
| Myf | 0.0025342 | JASPAR |
| SPI1 | 0.003475 | JASPAR |
BED file downloads
Top 10 Example Regions
| Location | Gene Link | Dist. |
|---|---|---|
| chr1: 149969640-149969790 | MTMR11 | 13.02 |
| chr15: 101481140-101481290 | ALDH1A3 | 44.61 |
| chr15: 101481140-101481290 | RP11-66B24.4 | 44.61 |
| chr15: 101481140-101481290 | LRRK1 | 44.61 |
| chr8: 37731400-37731550 | GPR124 | 52.71 |
| chr8: 37731400-37731550 | RAB11FIP1 | 52.71 |
| chr7: 97767200-97767350 | BHLHA15 | 53.89 |
| chr5: 149060420-149060570 | ARHGEF37 | 53.93 |
| chr19: 7538000-7538150 | ZNF358 | 54.66 |
| chr19: 7538000-7538150 | MCOLN1 | 54.66 |