SOM cluster: 279
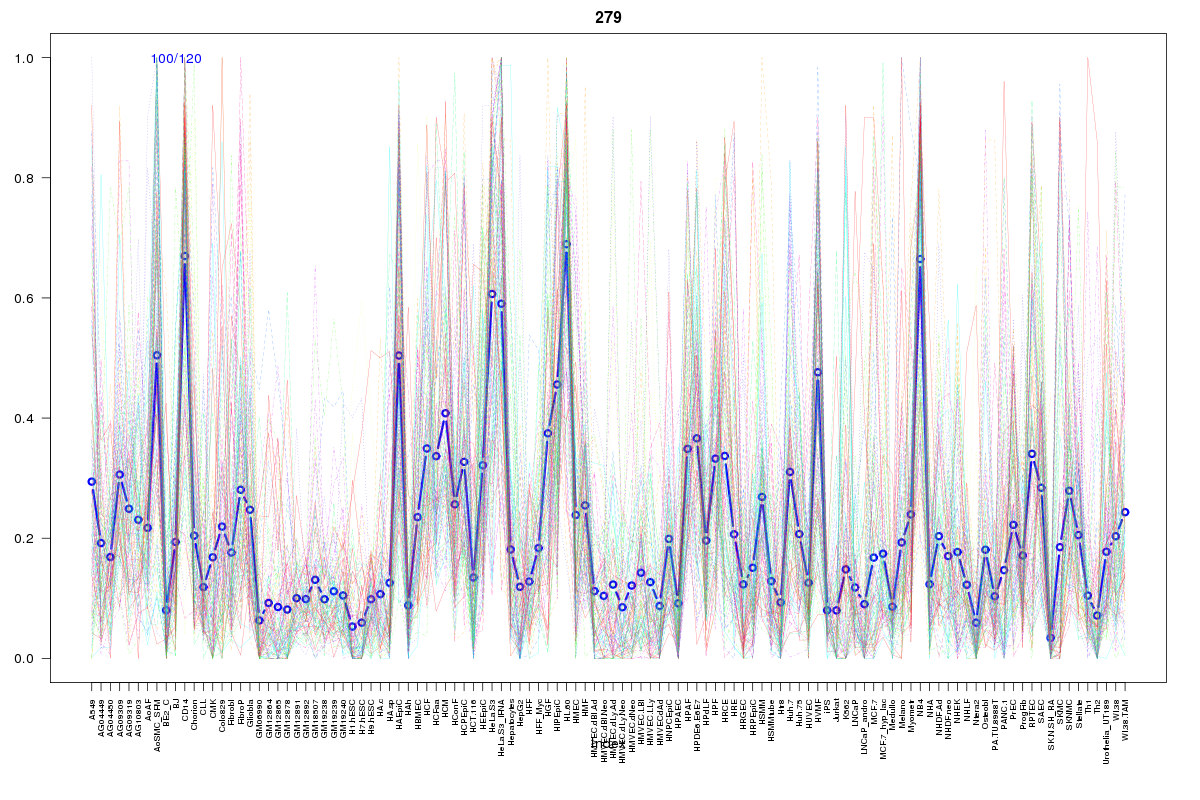
Cluster Hypersensitivity Profile

Genomic Location Trend
These plots show the distribution of the DHS sites surrounding the Transcript Start Site of the nearest gene.
Stats
Number of sites: 120Promoter: 7%
CpG-Island: 0%
Conserved: 40%
Enriched Motifs & Matches
Match Detail: [Jaspar]
|
| ||
|---|---|---|
| Sites: 47/100 | e-val: 0.0000000000058 | ||
| Factor | e-val(match) | DB |
| CEBPA | 0.0000000012625 | JASPAR |
| HLF | 0.000024087 | JASPAR |
| NFIL3 | 0.00024361 | JASPAR |
| Pou5f1 | 0.0011559 | JASPAR |
| Sox2 | 0.0023761 | JASPAR |