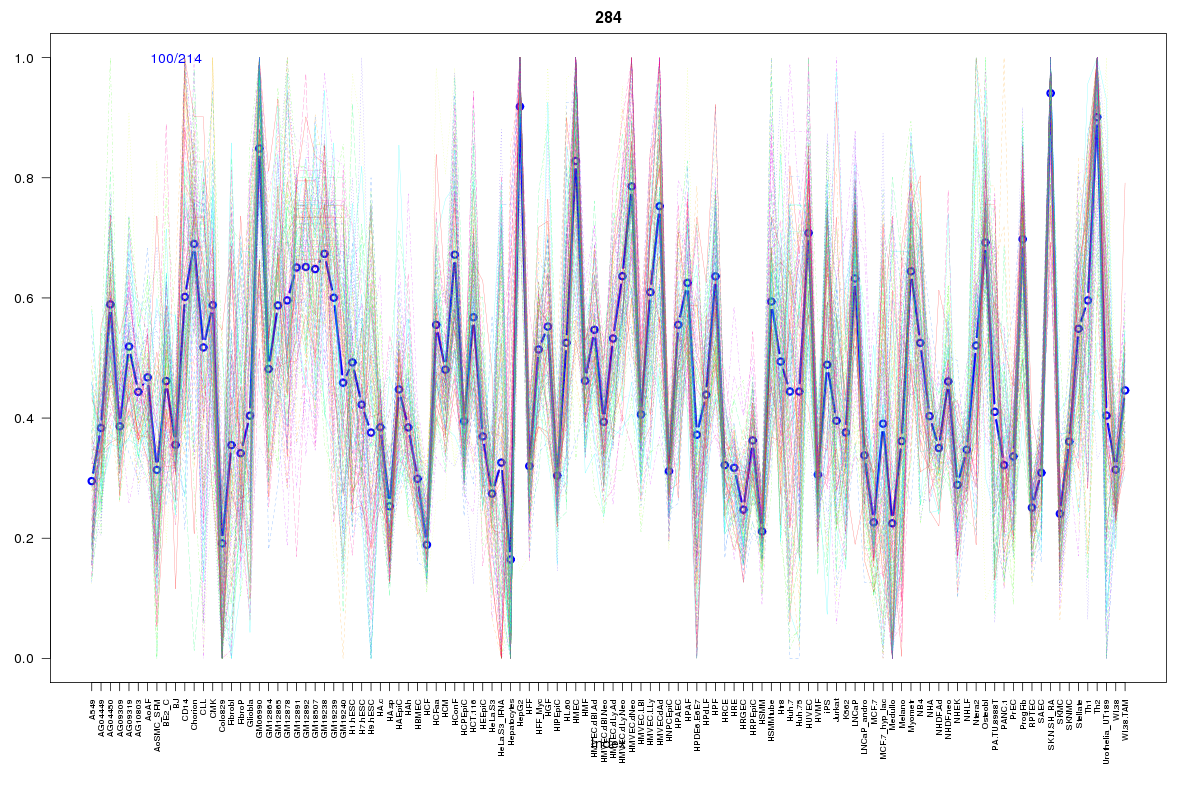
SOM cluster: 284
Cluster Hypersensitivity Profile

Genomic Location Trend
These plots show the distribution of the DHS sites surrounding the Transcript Start Site of the nearest gene.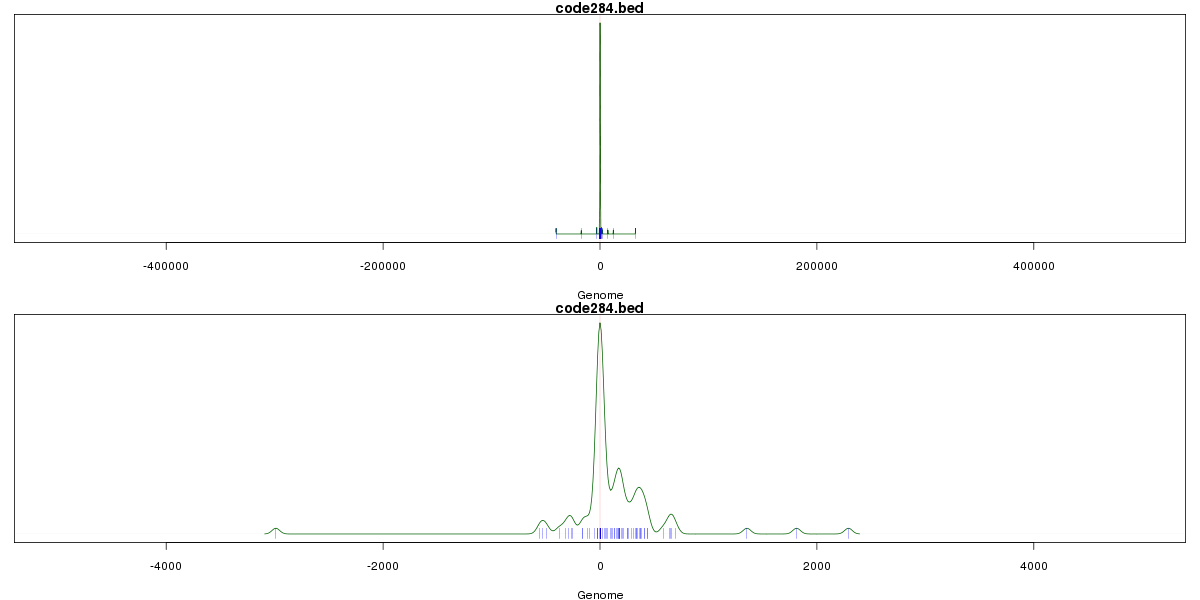
Stats
Number of sites: 214Promoter: 55%
CpG-Island: 95%
Conserved: 82%
Enriched Motifs & Matches
Match Detail: [Jaspar]
|
| ||
|---|---|---|
| Sites: 97/100 | e-val: 0 | ||
| Factor | e-val(match) | DB |
| TFAP2A | 0.000564 | JASPAR |
| SP1 | 0.0018436 | JASPAR |
| E2F1 | 0.045428 | JASPAR |
| PLAG1 | 0.060449 | JASPAR |
| Egr1 | 0.067466 | JASPAR |
|
| ||
| Sites: 83/100 | e-val: 7.00649e-45 | ||
| Factor | e-val(match) | DB |
| SP1 | 0.000000093035 | JASPAR |
| Klf4 | 0.000085694 | JASPAR |
| TFAP2A | 0.012601 | JASPAR |
| INSM1 | 0.016709 | JASPAR |
| Egr1 | 0.030543 | JASPAR |
|
| ||
| Sites: 57/100 | e-val: 0.0000000043 | ||
| Factor | e-val(match) | DB |
| SP1 | 0.00000053562 | JASPAR |
| TFAP2A | 0.00094904 | JASPAR |
| Egr1 | 0.011845 | JASPAR |
| Klf4 | 0.025857 | JASPAR |
| Zfx | 0.025871 | JASPAR |