SOM cluster: 292
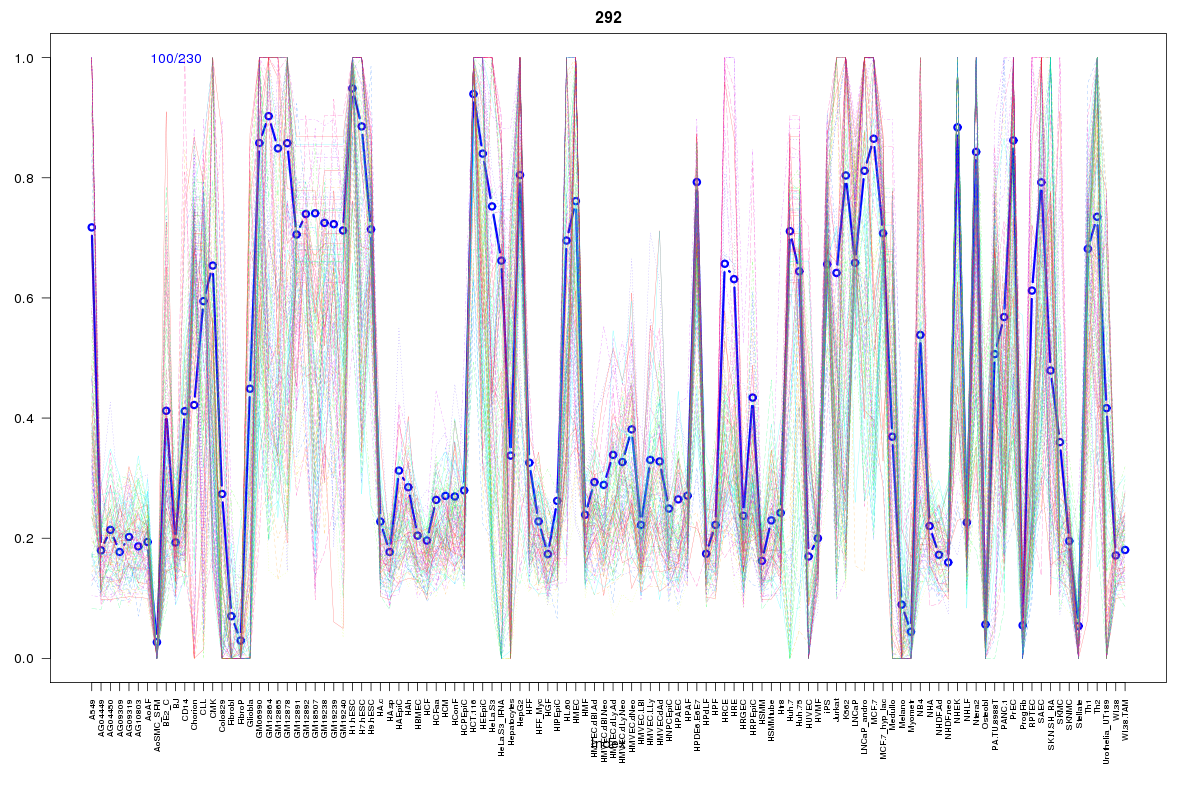
Cluster Hypersensitivity Profile

Genomic Location Trend
These plots show the distribution of the DHS sites surrounding the Transcript Start Site of the nearest gene.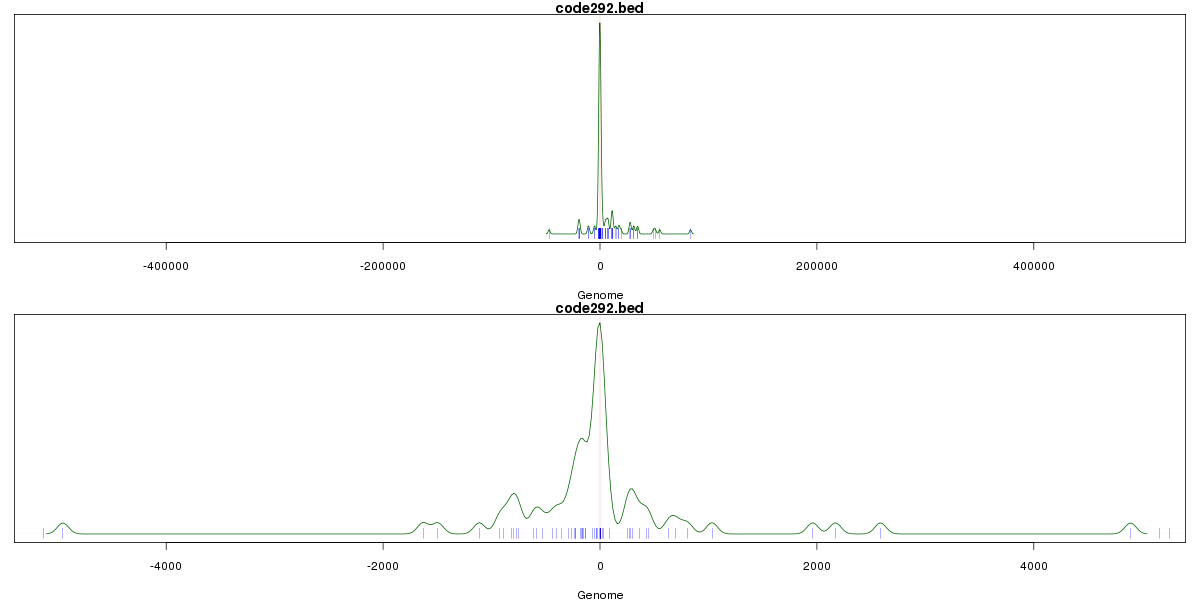
Stats
Number of sites: 230Promoter: 47%
CpG-Island: 57%
Conserved: 70%
Enriched Motifs & Matches
Match Detail: [Jaspar]
|
| ||
|---|---|---|
| Sites: 95/100 | e-val: 0 | ||
| Factor | e-val(match) | DB |
| SP1 | 0.00000000033286 | JASPAR |
| Klf4 | 0.00003863 | JASPAR |
| RREB1 | 0.0014018 | JASPAR |
| TFAP2A | 0.051308 | JASPAR |
| PLAG1 | 0.073158 | JASPAR |
|
| ||
| Sites: 94/100 | e-val: 4.9e-21 | ||
| Factor | e-val(match) | DB |
| SP1 | 0.00017725 | JASPAR |
| TFAP2A | 0.0027441 | JASPAR |
| ZEB1 | 0.0092569 | JASPAR |
| NHLH1 | 0.010408 | JASPAR |
| Arnt | 0.02595 | JASPAR |
|
| ||
| Sites: 29/100 | e-val: 0.000097 | ||
| Factor | e-val(match) | DB |
| SP1 | 0.0000000000063416 | JASPAR |
| Klf4 | 0.0000000097081 | JASPAR |
| Egr1 | 0.0000068622 | JASPAR |
| Zfx | 0.00089116 | JASPAR |
| INSM1 | 0.0106 | JASPAR |
BED file downloads
Top 10 Example Regions
| Location | Gene Link | Dist. |
|---|---|---|
| chr22: 36806140-36806290 | RP5-1119A7.14 | 44.72 |
| chr6: 27219180-27219330 | PRSS16 | 45.12 |
| chr12: 110283020-110283170 | GIT2 | 46.14 |
| chr2: 202098080-202098230 | CASP8 | 46.46 |
| chr2: 202098080-202098230 | ALS2CR12 | 46.46 |
| chr2: 202098080-202098230 | CASP10 | 46.46 |
| chr2: 202098080-202098230 | IMPDH1P10 | 46.46 |
| chr2: 202098080-202098230 | CFLAR | 46.46 |
| chr11: 118016405-118016555 | SCN4B | 49.3 |
| chr11: 118016405-118016555 | MPZL3 | 49.3 |