SOM cluster: 295
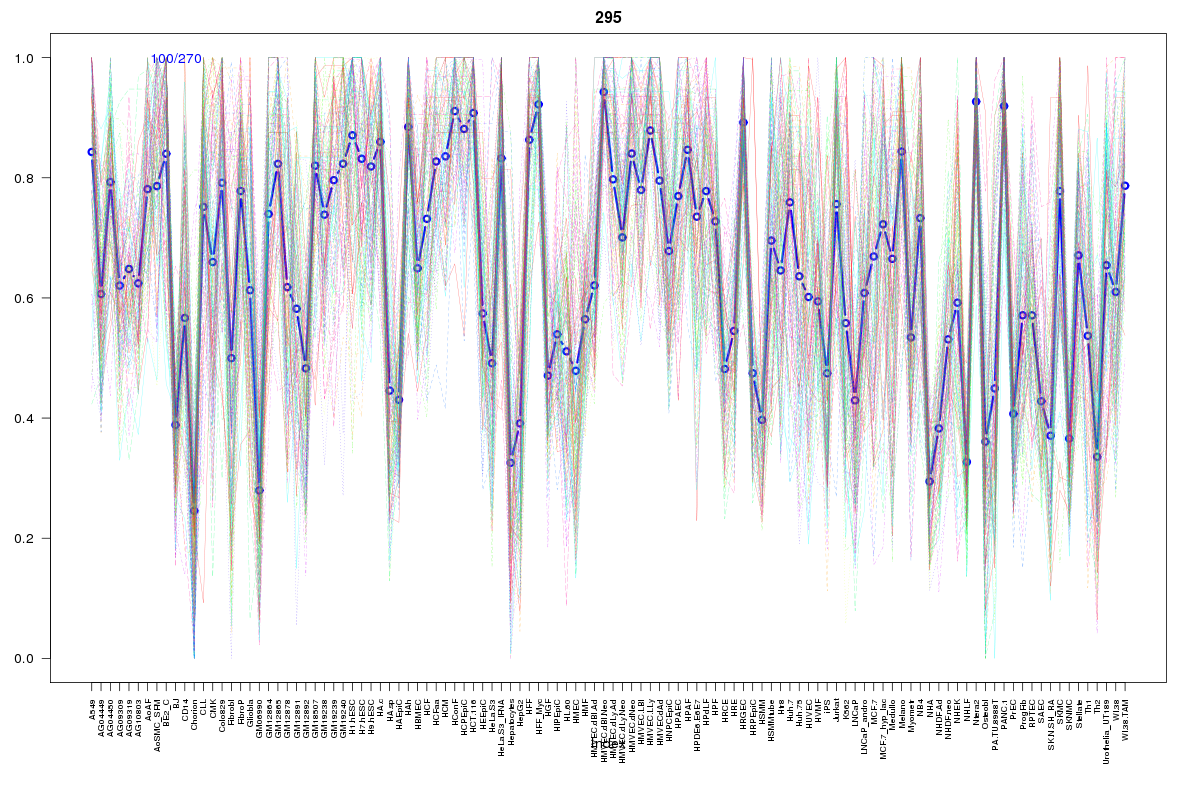
Cluster Hypersensitivity Profile

Genomic Location Trend
These plots show the distribution of the DHS sites surrounding the Transcript Start Site of the nearest gene.
Stats
Number of sites: 270Promoter: 1%
CpG-Island: 1%
Conserved: 84%
Enriched Motifs & Matches
Match Detail: [Jaspar]
|
| ||
|---|---|---|
| Sites: 88/100 | e-val: 0 | ||
| Factor | e-val(match) | DB |
| CTCF | 4.4409e-16 | JASPAR |
| INSM1 | 0.000025111 | JASPAR |
| MYC::MAX | 0.0022534 | JASPAR |
| TAL1::TCF3 | 0.0071132 | JASPAR |
| Zfp423 | 0.0080741 | JASPAR |
BED file downloads
Top 10 Example Regions
| Location | Gene Link | Dist. |
|---|---|---|
| chr1: 146966920-146967070 | BCL9 | 14.16 |
| chr1: 146966920-146967070 | OR13Z1P | 14.16 |
| chr13: 45883620-45883770 | SNORA31 | 44.4 |
| chr1: 209866340-209866490 | G0S2 | 45.12 |
| chr3: 149111260-149111410 | TM4SF18 | 51.08 |
| chr8: 94834660-94834810 | PDP1 | 51.7 |
| chr8: 94834660-94834810 | RP3-388N13.2 | 51.7 |
| chr1: 162006840-162006990 | ATF6 | 54.47 |
| chr1: 159167860-159168010 | CADM3 | 62.1 |
| chr1: 159167860-159168010 | DARC | 62.1 |