SOM cluster: 296
Cluster Hypersensitivity Profile

Genomic Location Trend
These plots show the distribution of the DHS sites surrounding the Transcript Start Site of the nearest gene.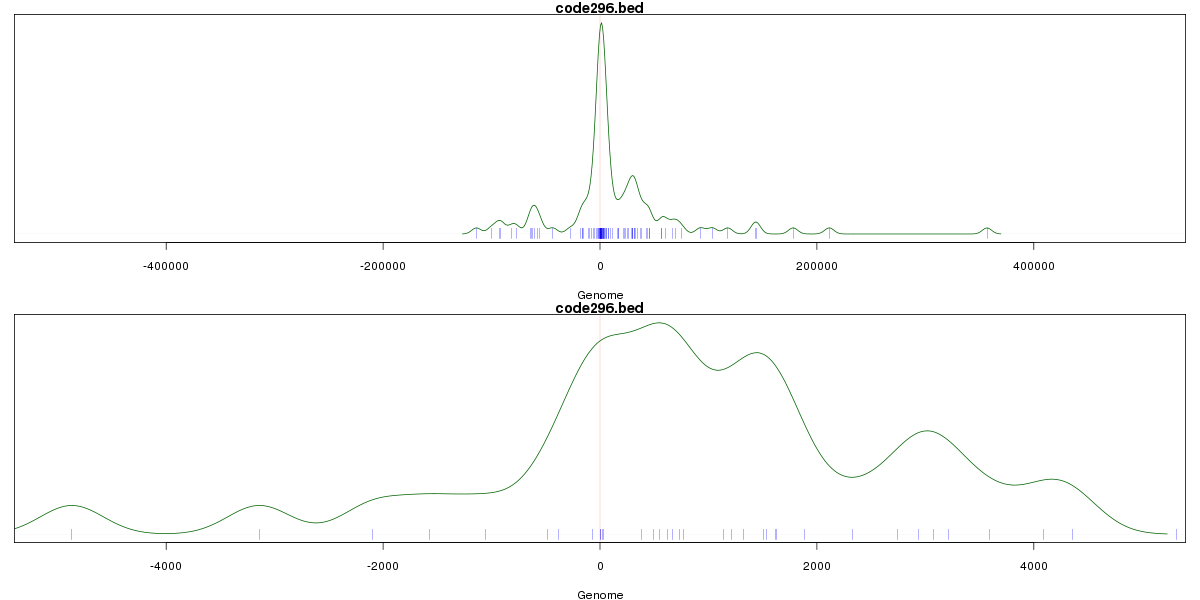
Stats
Number of sites: 103Promoter: 11%
CpG-Island: 9%
Conserved: 59%
Enriched Motifs & Matches
Match Detail: [Jaspar]
|
| ||
|---|---|---|
| Sites: 74/100 | e-val: 0 | ||
| Factor | e-val(match) | DB |
| AP1 | 0.00000000054296 | JASPAR |
| NFE2L2 | 0.0000012216 | JASPAR |
| NFE2L1::MafG | 0.014485 | JASPAR |
| PPARG | 0.038115 | JASPAR |
| CREB1 | 0.067423 | JASPAR |
|
| ||
| Sites: 63/100 | e-val: 0.00000000000019 | ||
| Factor | e-val(match) | DB |
| FEV | 0.000000000033575 | JASPAR |
| SPI1 | 0.00000000048782 | JASPAR |
| ELK4 | 0.0000000022623 | JASPAR |
| ELF5 | 0.00000021576 | JASPAR |
| Stat3 | 0.0000010711 | JASPAR |
BED file downloads
Top 10 Example Regions
| Location | Gene Link | Dist. |
|---|---|---|
| chr2: 122457060-122457210 | RPL12P15 | 44.44 |
| chr1: 159893520-159893670 | SLAMF9 | 46.28 |
| chr16: 70510520-70510670 | FUK | 62.61 |
| chr17: 80255760-80255910 | SLC16A3 | 67.06 |
| chr17: 80255760-80255910 | CSNK1D | 67.06 |
| chr1: 999600-999750 | ISG15 | 72.88 |
| chr1: 999600-999750 | RP11-465B22.3 | 72.88 |
| chr1: 159880300-159880450 | CCDC19 | 75.85 |
| chr1: 159880300-159880450 | IGSF9 | 75.85 |
| chr1: 159880300-159880450 | TAGLN2 | 75.85 |