SOM cluster: 301
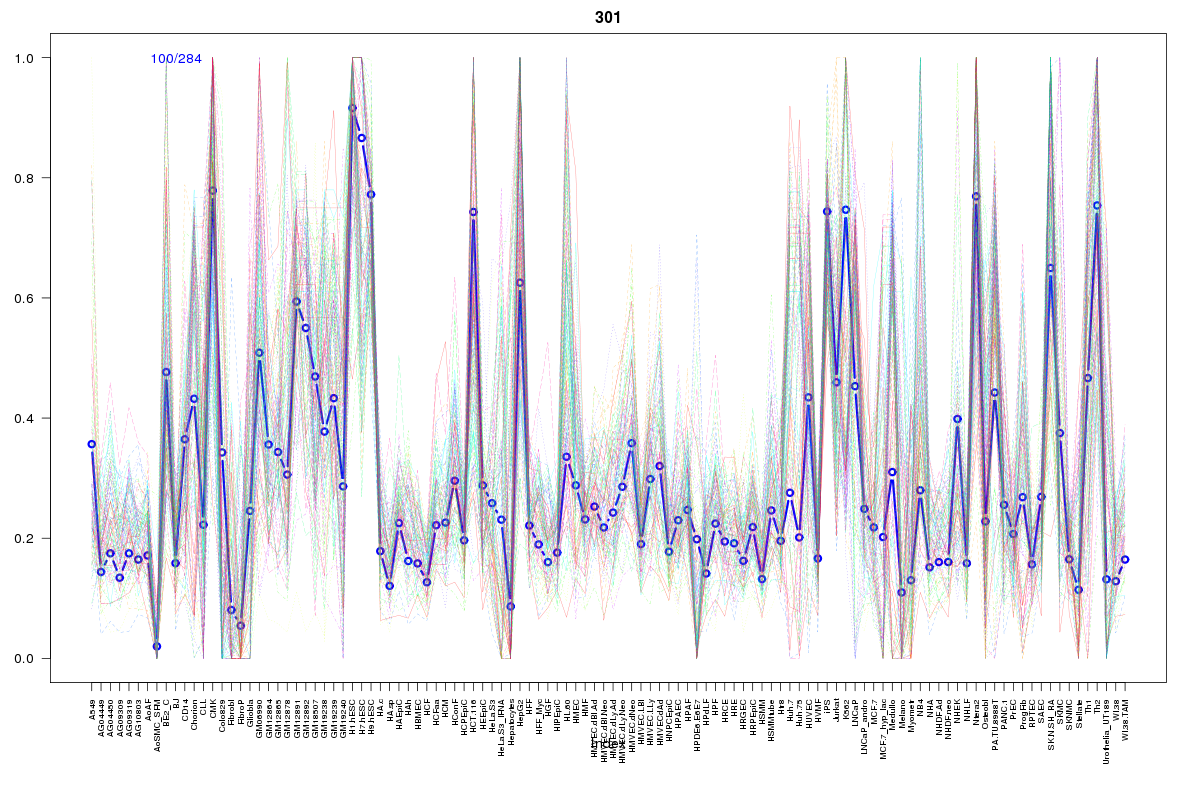
Cluster Hypersensitivity Profile

Genomic Location Trend
These plots show the distribution of the DHS sites surrounding the Transcript Start Site of the nearest gene.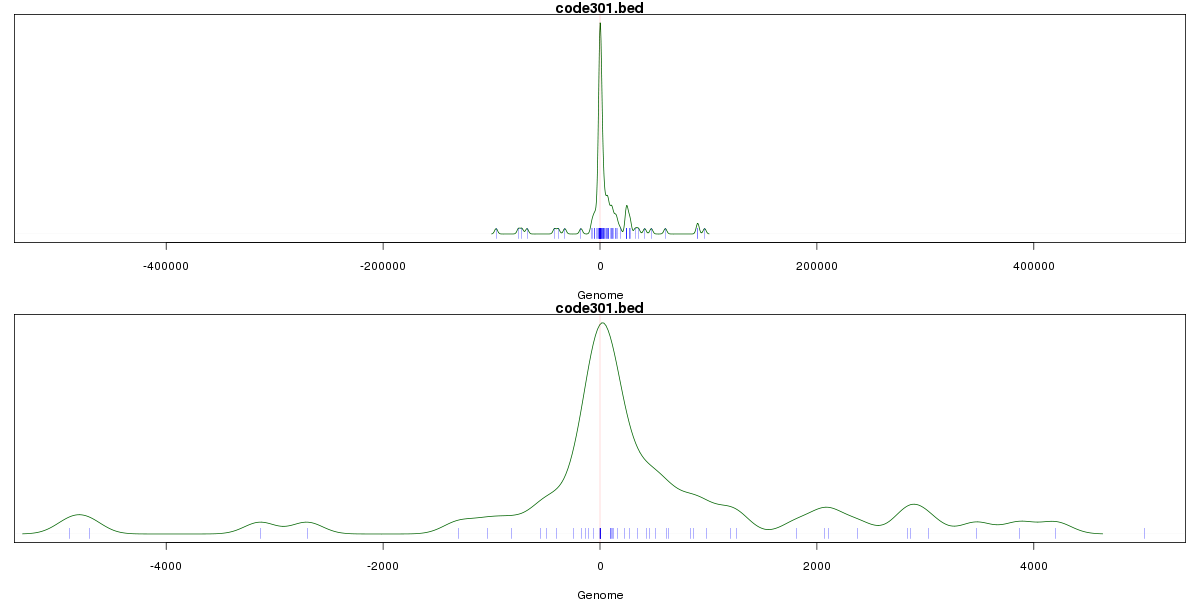
Stats
Number of sites: 284Promoter: 22%
CpG-Island: 60%
Conserved: 48%
Enriched Motifs & Matches
Match Detail: [Jaspar]
|
| ||
|---|---|---|
| Sites: 89/100 | e-val: 0 | ||
| Factor | e-val(match) | DB |
| SP1 | 0.0000000062666 | JASPAR |
| PLAG1 | 0.0000012937 | JASPAR |
| Klf4 | 0.0000013987 | JASPAR |
| RREB1 | 0.00004636 | JASPAR |
| TFAP2A | 0.00015587 | JASPAR |
|
| ||
| Sites: 86/100 | e-val: 2.7e-16 | ||
| Factor | e-val(match) | DB |
| SP1 | 0.000000000024822 | JASPAR |
| TFAP2A | 0.00026174 | JASPAR |
| Klf4 | 0.0015367 | JASPAR |
| PLAG1 | 0.0025411 | JASPAR |
| INSM1 | 0.0072721 | JASPAR |
|
| ||
| Sites: 33/100 | e-val: 0.81 | ||
| Factor | e-val(match) | DB |
| SP1 | 0.000000000020027 | JASPAR |
| Klf4 | 0.000000013226 | JASPAR |
| Zfx | 0.0040722 | JASPAR |
| Egr1 | 0.0061496 | JASPAR |
| Pax5 | 0.0095982 | JASPAR |
BED file downloads
Top 10 Example Regions
| Location | Gene Link | Dist. |
|---|---|---|
| chr9: 139606745-139607015 | FAM69B | 37.96 |
| chr9: 139606745-139607015 | AGPAT2 | 37.96 |
| chr1: 203764940-203765090 | ZC3H11A | 46.47 |
| chr1: 203764940-203765090 | SNORA77 | 46.47 |
| chr1: 203764940-203765090 | ZBED6 | 46.47 |
| chr1: 203764940-203765090 | ATP2B4 | 46.47 |
| chr19: 49399520-49399670 | GYS1 | 53.41 |
| chr19: 49399520-49399670 | TULP2 | 53.41 |
| chr12: 109535280-109535430 | UNG | 53.48 |
| chr12: 109535280-109535430 | ALKBH2 | 53.48 |