SOM cluster: 303
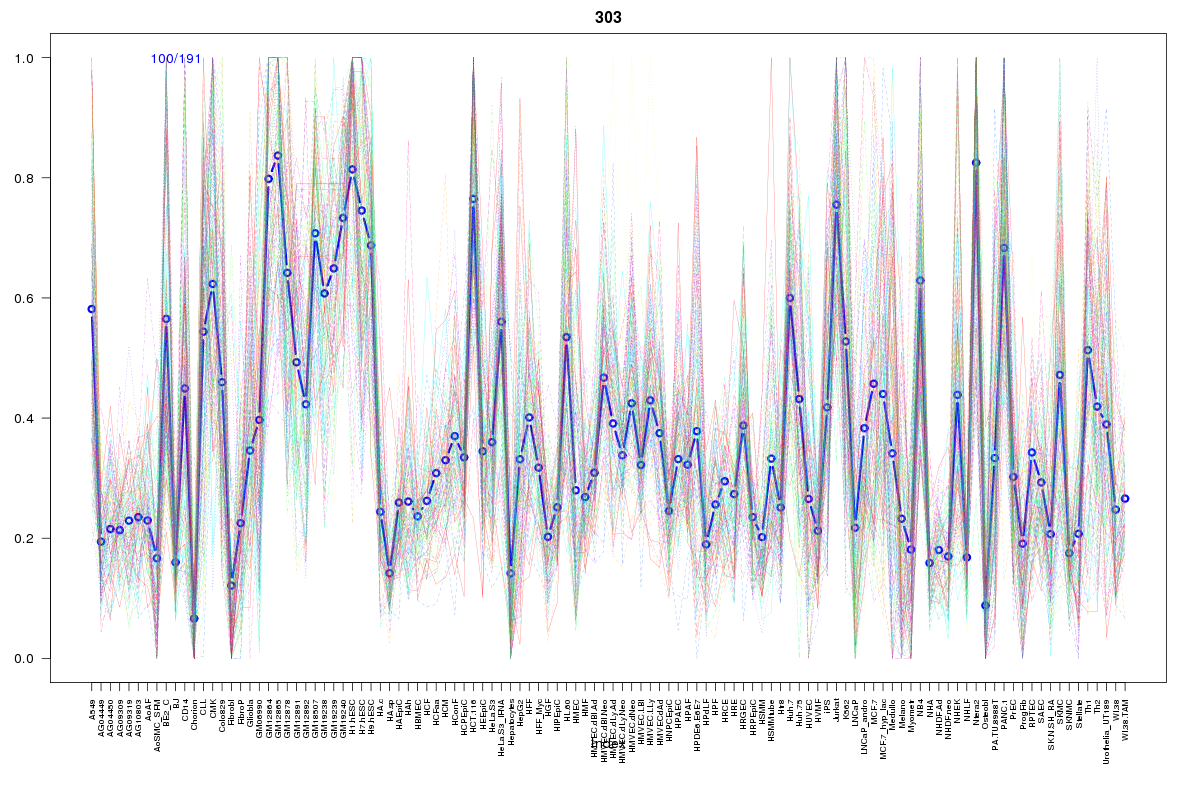
Cluster Hypersensitivity Profile

Genomic Location Trend
These plots show the distribution of the DHS sites surrounding the Transcript Start Site of the nearest gene.
Stats
Number of sites: 191Promoter: 6%
CpG-Island: 0%
Conserved: 57%
Enriched Motifs & Matches
Match Detail: [Jaspar]
|
| ||
|---|---|---|
| Sites: 63/100 | e-val: 0 | ||
| Factor | e-val(match) | DB |
| CTCF | 0 | JASPAR |
| INSM1 | 0.0000066086 | JASPAR |
| MYC::MAX | 0.0087386 | JASPAR |
| Zfp423 | 0.011345 | JASPAR |
| SP1 | 0.012227 | JASPAR |
BED file downloads
Top 10 Example Regions
| Location | Gene Link | Dist. |
|---|---|---|
| chr9: 117443900-117444050 | ATP6V1G1 | 39.31 |
| chr9: 117443900-117444050 | C9orf91 | 39.31 |
| chr8: 10834785-10834935 | XKR6 | 46.98 |
| chr1: 149900160-149900310 | MTMR11 | 51.89 |
| chr1: 149900160-149900310 | HIST2H2AB | 51.89 |
| chr19: 30181960-30182110 | POP4 | 52.53 |
| chr1: 25363760-25363910 | RP11-84D1.1 | 57.93 |
| chr11: 35327440-35327590 | SLC1A2 | 59 |
| chr5: 157096080-157096230 | THG1L | 62.74 |
| chr7: 150573880-150574030 | TMEM176A | 63.53 |