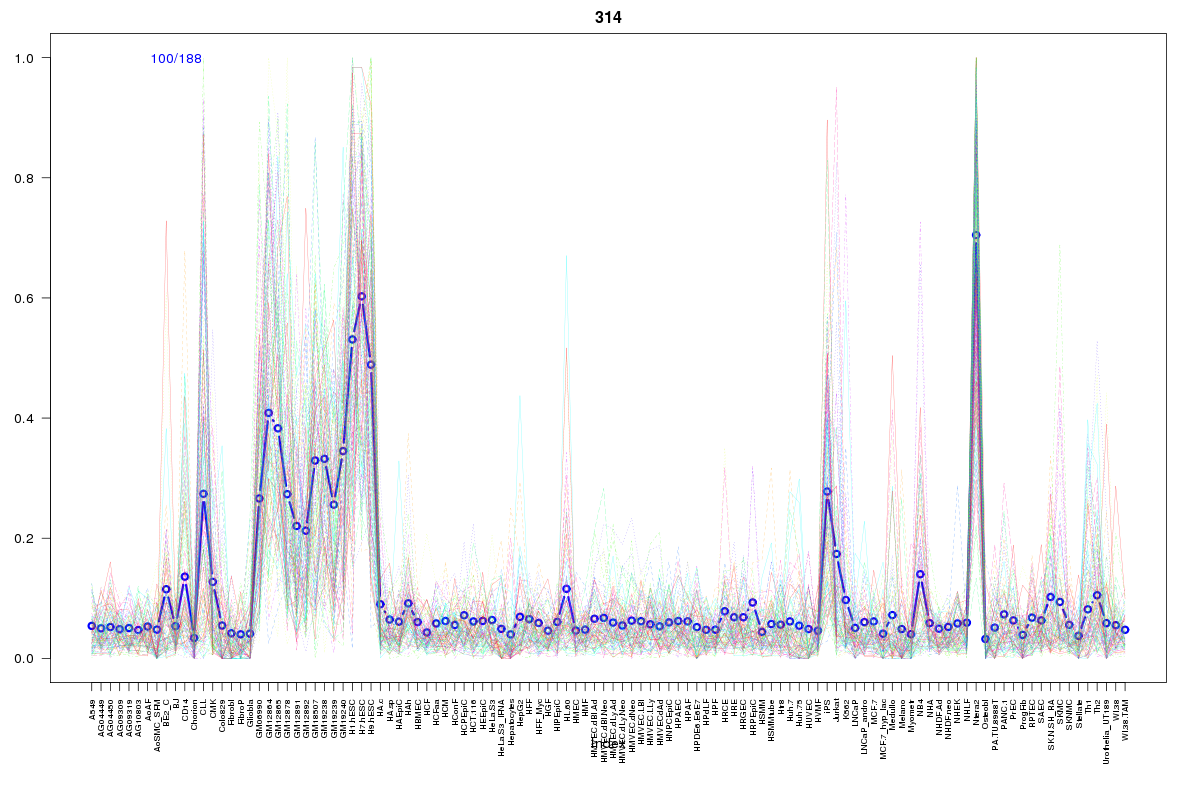
SOM cluster: 314
Cluster Hypersensitivity Profile

Genomic Location Trend
These plots show the distribution of the DHS sites surrounding the Transcript Start Site of the nearest gene.
Stats
Number of sites: 188Promoter: 2%
CpG-Island: 3%
Conserved: 41%
Enriched Motifs & Matches
Match Detail: [Jaspar]
|
| ||
|---|---|---|
| Sites: 38/100 | e-val: 7.1e-16 | ||
| Factor | e-val(match) | DB |
| Pou5f1 | 0.0000000039755 | JASPAR |
| Sox2 | 0.0000052428 | JASPAR |
| HOXA5 | 0.0024424 | JASPAR |
| FOXA1 | 0.0039256 | JASPAR |
| NFATC2 | 0.0041908 | JASPAR |
|
| ||
| Sites: 35/100 | e-val: 0.000000000028 | ||
| Factor | e-val(match) | DB |
| SP1 | 0.0000000000024115 | JASPAR |
| Pax4 | 0.00000040973 | JASPAR |
| Tal1::Gata1 | 0.000030537 | JASPAR |
| MZF1_1-4 | 0.0016311 | JASPAR |
| MZF1_5-13 | 0.001801 | JASPAR |
BED file downloads
Top 10 Example Regions
| Location | Gene Link | Dist. |
|---|---|---|
| chr3: 10268200-10268350 | IRAK2 | 26.61 |
| chr3: 10268200-10268350 | BRK1 | 26.61 |
| chr10: 13394600-13394750 | SEPHS1 | 51.49 |
| chr9: 132651840-132651990 | FNBP1 | 57.74 |
| chr9: 132651840-132651990 | TOR1B | 57.74 |
| chr3: 170883280-170883430 | TNIK | 59.47 |
| chr15: 78608845-78608995 | CRABP1 | 61.74 |
| chr6: 30806200-30806350 | XXbac-BPG27H4.8 | 62.73 |
| chr9: 27353600-27353750 | MOB3B | 64.64 |
| chr3: 124861420-124861570 | SLC12A8 | 65.46 |