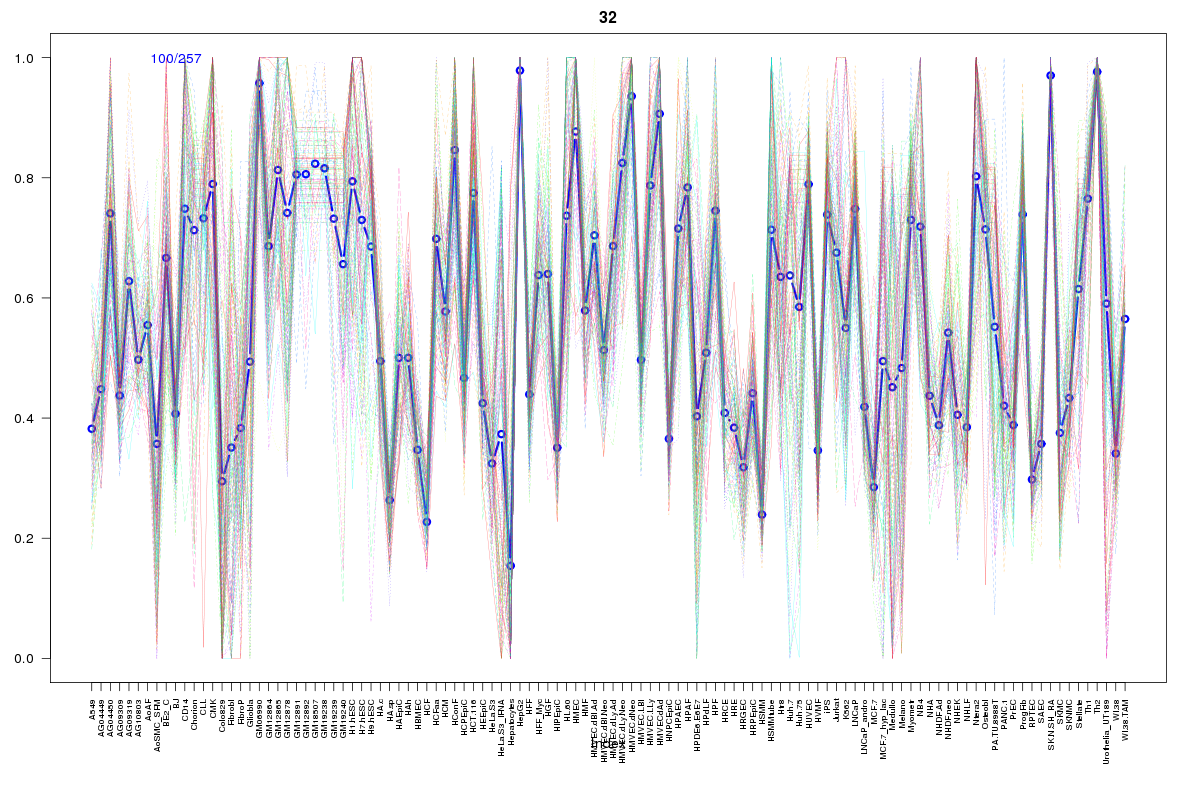
SOM cluster: 32
Cluster Hypersensitivity Profile

Genomic Location Trend
These plots show the distribution of the DHS sites surrounding the Transcript Start Site of the nearest gene.
Stats
Number of sites: 257Promoter: 64%
CpG-Island: 91%
Conserved: 90%
Enriched Motifs & Matches
Match Detail: [Jaspar]
|
| ||
|---|---|---|
| Sites: 94/100 | e-val: 0 | ||
| Factor | e-val(match) | DB |
| SP1 | 0.000052999 | JASPAR |
| Egr1 | 0.002009 | JASPAR |
| Klf4 | 0.0057652 | JASPAR |
| TFAP2A | 0.0061196 | JASPAR |
| NHLH1 | 0.016683 | JASPAR |
|
| ||
| Sites: 77/100 | e-val: 3.19496e-43 | ||
| Factor | e-val(match) | DB |
| SP1 | 0.0000019348 | JASPAR |
| TFAP2A | 0.00068628 | JASPAR |
| Klf4 | 0.0056055 | JASPAR |
| PLAG1 | 0.0057405 | JASPAR |
| Zfx | 0.019208 | JASPAR |
BED file downloads
Top 10 Example Regions
| Location | Gene Link | Dist. |
|---|---|---|
| chr7: 138720760-138720910 | ZC3HAV1L | 37.43 |
| chr1: 234614460-234614610 | TARBP1 | 53.15 |
| chr3: 179370680-179370830 | USP13 | 55.34 |
| chr1: 90098440-90098590 | RP5-1007M22.2 | 57.05 |
| chr4: 40058400-40058550 | SNORA51 | 58.8 |
| chr4: 40058400-40058550 | N4BP2 | 58.8 |
| chr3: 32509380-32509530 | CMTM7 | 62.11 |
| chr16: 75600120-75600270 | TMEM231 | 62.65 |
| chr22: 42196420-42196570 | CCDC134 | 64.23 |
| chr11: 124670260-124670410 | RP11-677M14.7 | 66.09 |