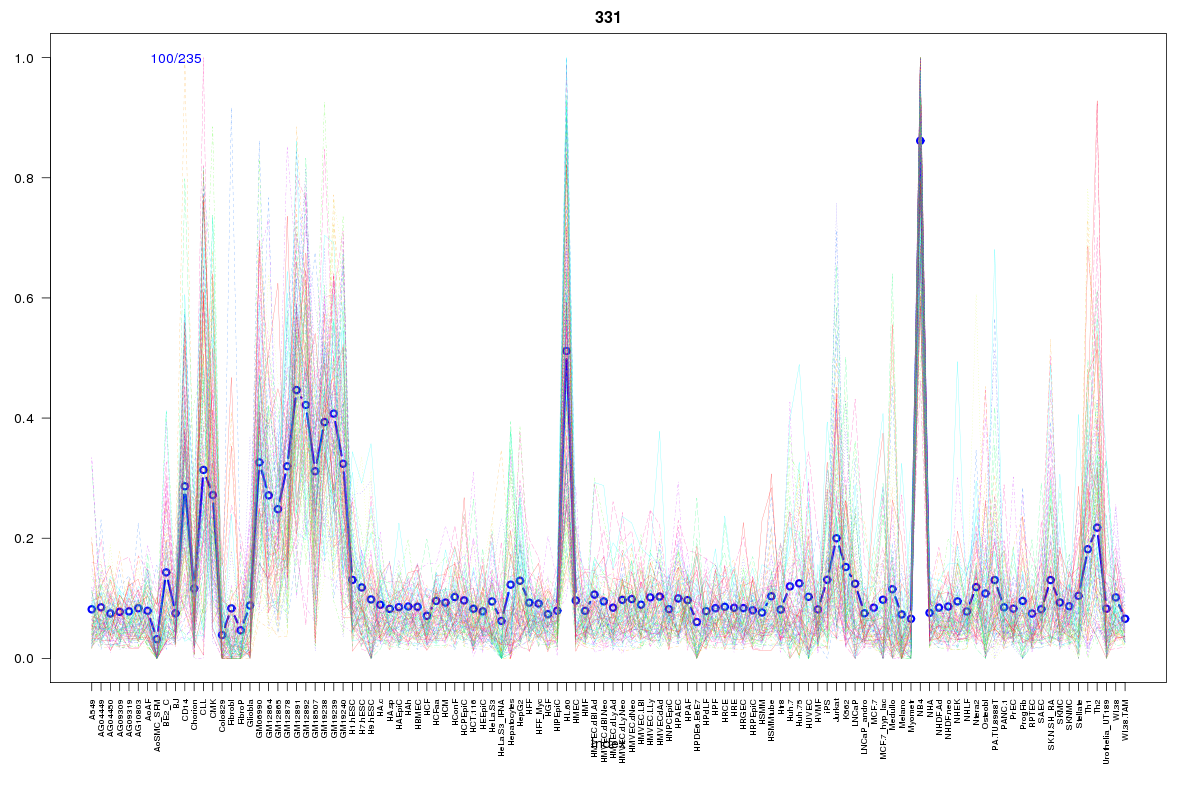
SOM cluster: 331
Cluster Hypersensitivity Profile

Genomic Location Trend
These plots show the distribution of the DHS sites surrounding the Transcript Start Site of the nearest gene.
Stats
Number of sites: 235Promoter: 12%
CpG-Island: 14%
Conserved: 27%
Enriched Motifs & Matches
Match Detail: [Jaspar]
|
| ||
|---|---|---|
| Sites: 83/100 | e-val: 6.3e-24 | ||
| Factor | e-val(match) | DB |
| SP1 | 0.000000050609 | JASPAR |
| RREB1 | 0.00000062036 | JASPAR |
| Klf4 | 0.00055176 | JASPAR |
| Pax4 | 0.00071589 | JASPAR |
| Egr1 | 0.0020191 | JASPAR |
|
| ||
| Sites: 40/100 | e-val: 0.00000000096 | ||
| Factor | e-val(match) | DB |
| SPIB | 0.000000006541 | JASPAR |
| SPI1 | 0.00000092341 | JASPAR |
| FEV | 0.00022499 | JASPAR |
| Stat3 | 0.00023532 | JASPAR |
| ELK4 | 0.000297 | JASPAR |
|
| ||
| Sites: 29/100 | e-val: 0.89 | ||
| Factor | e-val(match) | DB |
| EBF1 | 0.00000035774 | JASPAR |
| Zfp423 | 0.0000044827 | JASPAR |
| TFAP2A | 0.000013565 | JASPAR |
| PLAG1 | 0.00046739 | JASPAR |
| INSM1 | 0.0019069 | JASPAR |
BED file downloads
Top 10 Example Regions
| Location | Gene Link | Dist. |
|---|---|---|
| chr22: 39747960-39748110 | SNORD83A | 39.67 |
| chr22: 39747960-39748110 | RPL3 | 39.67 |
| chr19: 10223580-10223730 | SNORD105 | 43.69 |
| chr19: 10223580-10223730 | EIF3G | 43.69 |
| chr19: 10223580-10223730 | PPAN-P2RY11 | 43.69 |
| chr19: 10223580-10223730 | ANGPTL6 | 43.69 |
| chr19: 10223580-10223730 | P2RY11 | 43.69 |
| chr19: 10223580-10223730 | DNMT1 | 43.69 |
| chr19: 10223580-10223730 | PPAN | 43.69 |
| chr19: 33651660-33651810 | LRP3 | 46.08 |