SOM cluster: 332
Cluster Hypersensitivity Profile

Genomic Location Trend
These plots show the distribution of the DHS sites surrounding the Transcript Start Site of the nearest gene.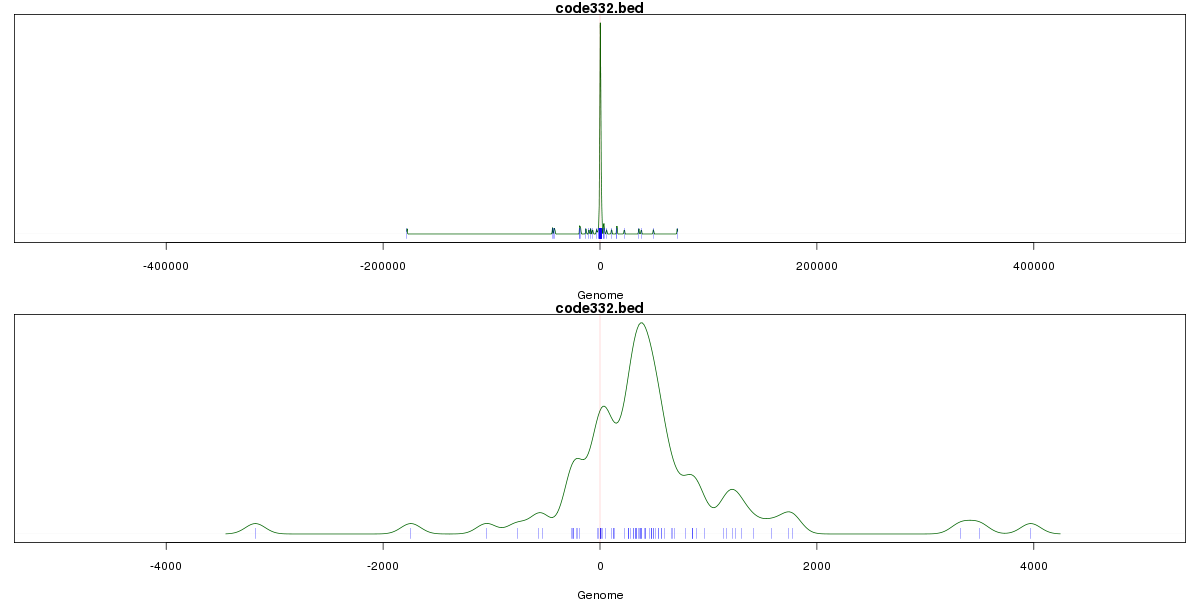
Stats
Number of sites: 212Promoter: 25%
CpG-Island: 89%
Conserved: 50%
Enriched Motifs & Matches
Match Detail: [Jaspar]
|
| ||
|---|---|---|
| Sites: 88/100 | e-val: 0 | ||
| Factor | e-val(match) | DB |
| SP1 | 0.000005386 | JASPAR |
| TFAP2A | 0.0001541 | JASPAR |
| Klf4 | 0.028438 | JASPAR |
| Zfx | 0.035181 | JASPAR |
| PLAG1 | 0.051638 | JASPAR |
|
| ||
| Sites: 66/100 | e-val: 2.6e-17 | ||
| Factor | e-val(match) | DB |
| SP1 | 0.000040383 | JASPAR |
| TFAP2A | 0.00011169 | JASPAR |
| PLAG1 | 0.002607 | JASPAR |
| Zfp423 | 0.042625 | JASPAR |
| TP53 | 0.052498 | JASPAR |
BED file downloads
Top 10 Example Regions
| Location | Gene Link | Dist. |
|---|---|---|
| chr5: 118691580-118691730 | TNFAIP8 | 22.75 |
| chr3: 179041500-179041650 | GNB4 | 45.67 |
| chr9: 139439725-139439875 | RP11-413M3.4 | 50.64 |
| chr5: 114937760-114937910 | TMED7 | 57.75 |
| chr5: 175792380-175792530 | ARL10 | 59.79 |
| chr17: 40439360-40439510 | STAT5A | 60.73 |
| chr17: 40439360-40439510 | GHDC | 60.73 |
| chr17: 40439360-40439510 | STAT5B | 60.73 |
| chr19: 38042720-38042870 | ZNF570 | 60.79 |
| chr19: 38042720-38042870 | CTD-3064H18.4 | 60.79 |