SOM cluster: 334
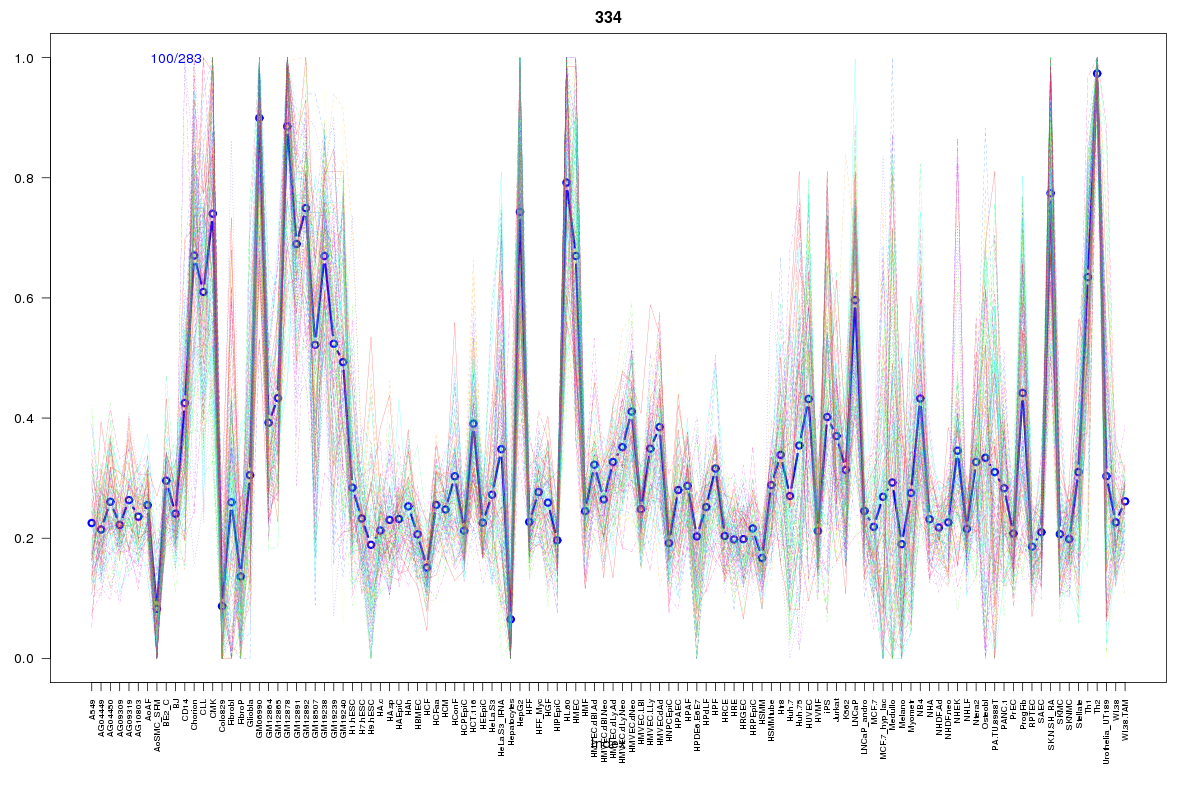
Cluster Hypersensitivity Profile

Genomic Location Trend
These plots show the distribution of the DHS sites surrounding the Transcript Start Site of the nearest gene.
Stats
Number of sites: 283Promoter: 29%
CpG-Island: 98%
Conserved: 68%
Enriched Motifs & Matches
Match Detail: [Jaspar]
|
| ||
|---|---|---|
| Sites: 100/100 | e-val: 0 | ||
| Factor | e-val(match) | DB |
| TFAP2A | 0.00022411 | JASPAR |
| SP1 | 0.013473 | JASPAR |
| Zfx | 0.015287 | JASPAR |
| PLAG1 | 0.068919 | JASPAR |
| Klf4 | 0.085021 | JASPAR |
|
| ||
| Sites: 92/100 | e-val: 0 | ||
| Factor | e-val(match) | DB |
| PLAG1 | 0.000000012735 | JASPAR |
| TFAP2A | 0.000000067803 | JASPAR |
| SP1 | 0.003246 | JASPAR |
| Klf4 | 0.052164 | JASPAR |
| Zfx | 0.069429 | JASPAR |
|
| ||
| Sites: 69/100 | e-val: 3.5e-16 | ||
| Factor | e-val(match) | DB |
| SP1 | 0.000070602 | JASPAR |
| Zfx | 0.0024764 | JASPAR |
| TFAP2A | 0.018002 | JASPAR |
| Egr1 | 0.027771 | JASPAR |
| MZF1_1-4 | 0.057865 | JASPAR |
BED file downloads
Top 10 Example Regions
| Location | Gene Link | Dist. |
|---|---|---|
| chr1: 151031765-151031915 | TNFAIP8L2 | 20.6 |
| chr1: 151031765-151031915 | SETDB1 | 20.6 |
| chr1: 151031765-151031915 | SEMA6C | 20.6 |
| chr1: 151031765-151031915 | C1orf56 | 20.6 |
| chr19: 13260840-13260990 | NFIX | 45.47 |
| chr12: 117628000-117628150 | TESC | 48.45 |
| chr19: 12250880-12251030 | ZNF878 | 48.72 |
| chr12: 120972265-120972415 | TRIAP1 | 48.93 |
| chr1: 151255065-151255215 | SELENBP1 | 53.65 |
| chr17: 49197700-49197850 | NME1 | 56.54 |