SOM cluster: 335
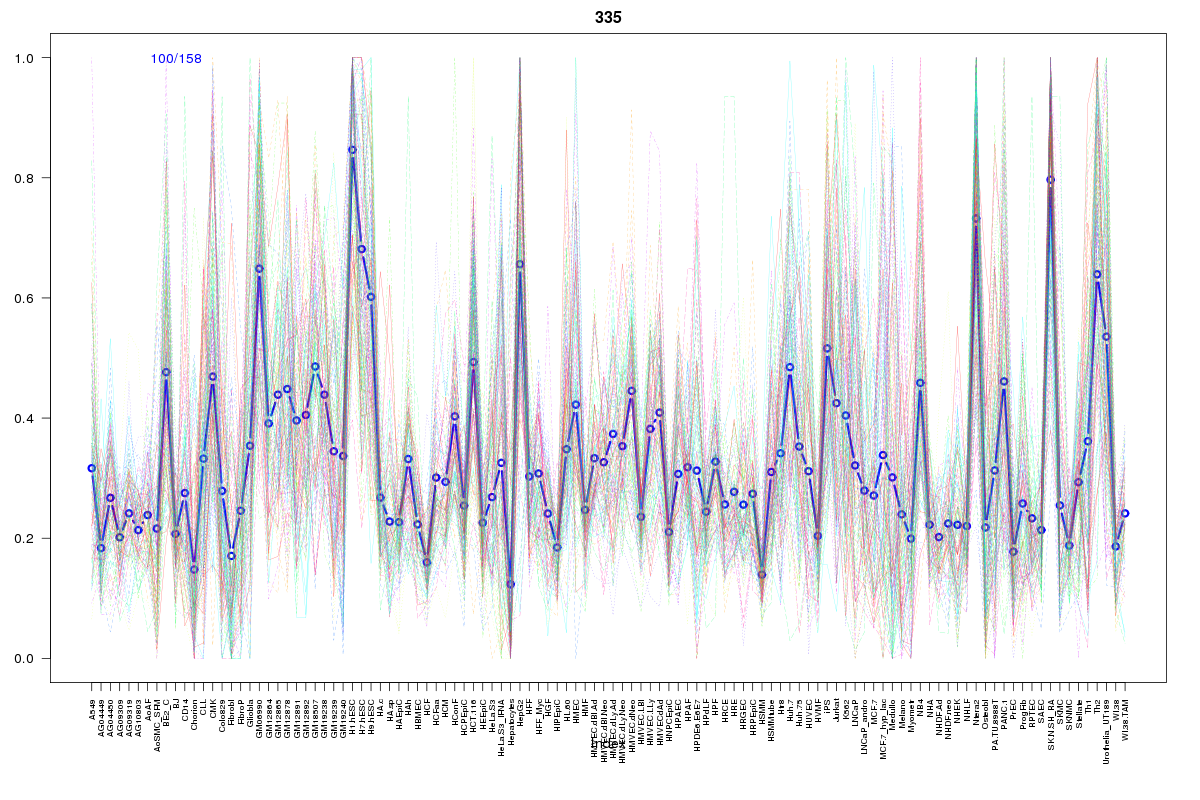
Cluster Hypersensitivity Profile

Genomic Location Trend
These plots show the distribution of the DHS sites surrounding the Transcript Start Site of the nearest gene.
Stats
Number of sites: 158Promoter: 36%
CpG-Island: 67%
Conserved: 47%
Enriched Motifs & Matches
Match Detail: [Jaspar]
|
| ||
|---|---|---|
| Sites: 99/100 | e-val: 0 | ||
| Factor | e-val(match) | DB |
| SP1 | 0.0000000016758 | JASPAR |
| Egr1 | 0.00035628 | JASPAR |
| Klf4 | 0.0044234 | JASPAR |
| TFAP2A | 0.010282 | JASPAR |
| PLAG1 | 0.010681 | JASPAR |
|
| ||
| Sites: 55/100 | e-val: 0.0000000000000051 | ||
| Factor | e-val(match) | DB |
| SP1 | 0.000021483 | JASPAR |
| PLAG1 | 0.00096249 | JASPAR |
| TFAP2A | 0.01024 | JASPAR |
| CTCF | 0.012416 | JASPAR |
| Klf4 | 0.015933 | JASPAR |
BED file downloads
Top 10 Example Regions
| Location | Gene Link | Dist. |
|---|---|---|
| chr1: 150899040-150899190 | ARNT | 16.15 |
| chr1: 150899040-150899190 | PRUNE | 16.15 |
| chr1: 150899040-150899190 | SETDB1 | 16.15 |
| chr1: 150899040-150899190 | FAM63A | 16.15 |
| chr1: 149871200-149871350 | BOLA1 | 18.38 |
| chr1: 149871200-149871350 | HIST2H2AB | 18.38 |
| chr1: 150848620-150848770 | RP11-316M1.3 | 21.5 |
| chr1: 150848620-150848770 | CTSK | 21.5 |
| chrX: 112084100-112084250 | AMOT | 48.52 |
| chr1: 150038980-150039130 | VPS45 | 48.71 |