SOM cluster: 341
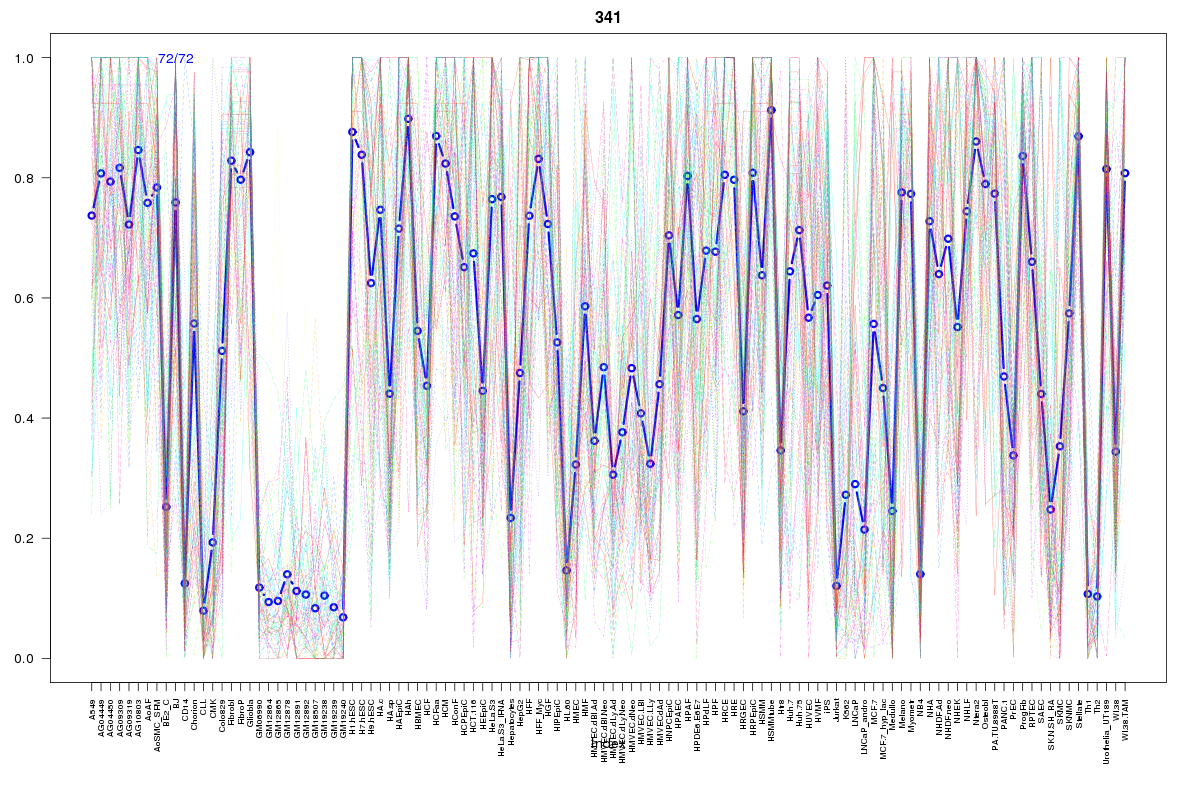
Cluster Hypersensitivity Profile

Genomic Location Trend
These plots show the distribution of the DHS sites surrounding the Transcript Start Site of the nearest gene.
Stats
Number of sites: 72Promoter: 18%
CpG-Island: 9%
Conserved: 55%
Enriched Motifs & Matches
Match Detail: [Jaspar]
|
| ||
|---|---|---|
| Sites: 47/72 | e-val: 1.9e-30 | ||
| Factor | e-val(match) | DB |
| SP1 | 0.000000093265 | JASPAR |
| EWSR1-FLI1 | 0.00000054048 | JASPAR |
| RREB1 | 0.000055716 | JASPAR |
| Pax4 | 0.00032499 | JASPAR |
| PLAG1 | 0.0013939 | JASPAR |
|
| ||
| Sites: 47/72 | e-val: 0.00000000000011 | ||
| Factor | e-val(match) | DB |
| TEAD1 | 0.0000000012267 | JASPAR |
| FEV | 0.00021585 | JASPAR |
| Stat3 | 0.0005735 | JASPAR |
| REL | 0.00098441 | JASPAR |
| NF-kappaB | 0.0013304 | JASPAR |
BED file downloads
Top 10 Example Regions
| Location | Gene Link | Dist. |
|---|---|---|
| chr3: 8783360-8783510 | OXTR | 40.57 |
| chr3: 8783360-8783510 | CAV3 | 40.57 |
| chr17: 48764120-48764270 | ABCC3 | 47.32 |
| chr17: 48764120-48764270 | LUC7L3 | 47.32 |
| chr17: 48764120-48764270 | ANKRD40 | 47.32 |
| chr11: 68811860-68812010 | RP11-554A11.6 | 52.17 |
| chr12: 119616520-119616670 | RP11-364C11.2 | 59.71 |
| chr12: 119616520-119616670 | HSPB8 | 59.71 |
| chr11: 69451380-69451530 | CCND1 | 60.6 |
| chr6: 37027460-37027610 | FGD2 | 63.89 |